 CLOSETHEGAP
02 · Digital · The HIGHDEL app · Beta
Goals, KPIs and problem solving – for your team.
H·DELTA Business turns company goals into daily execution: from strategy through tasks and KPIs to structured problem solving in the team. Close the gap. Every day.
- Break goals down into tasks
- Track KPIs daily
- Solve problems in a structured way
The principle
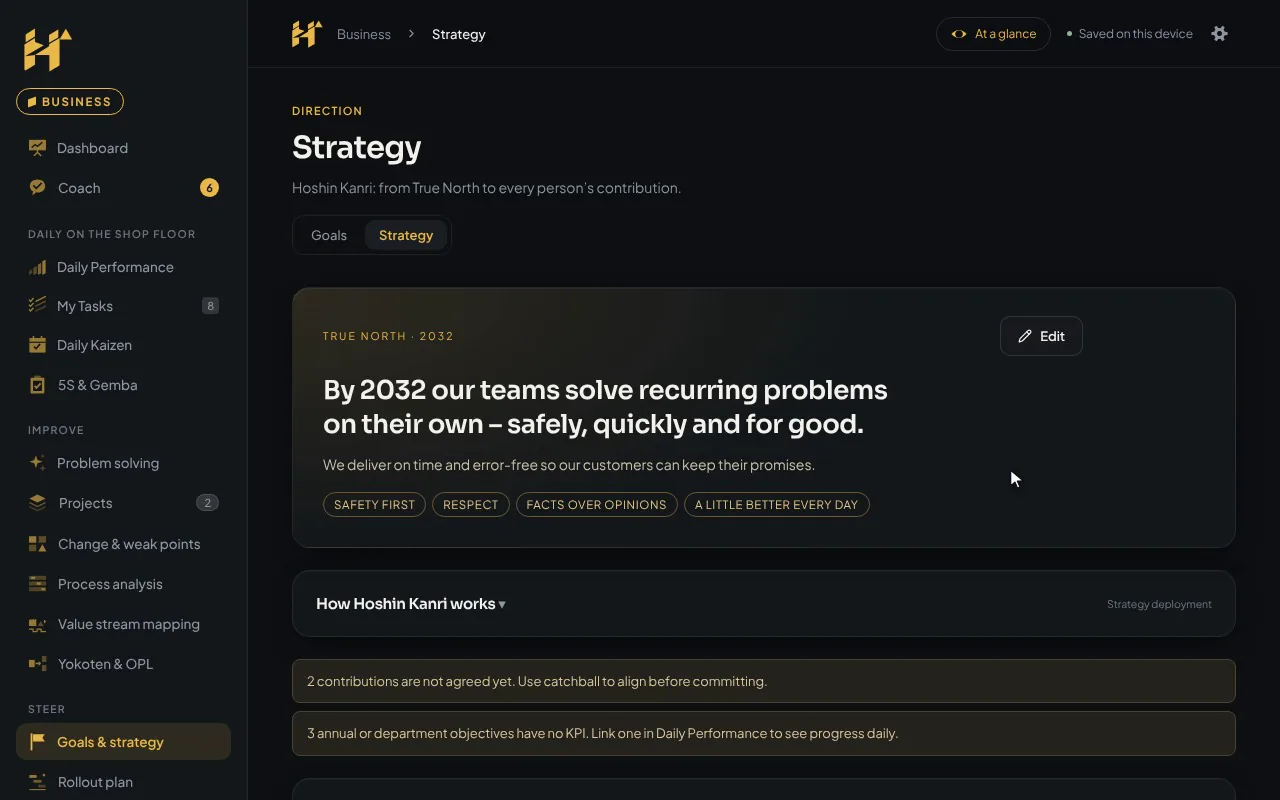
From strategy to today.
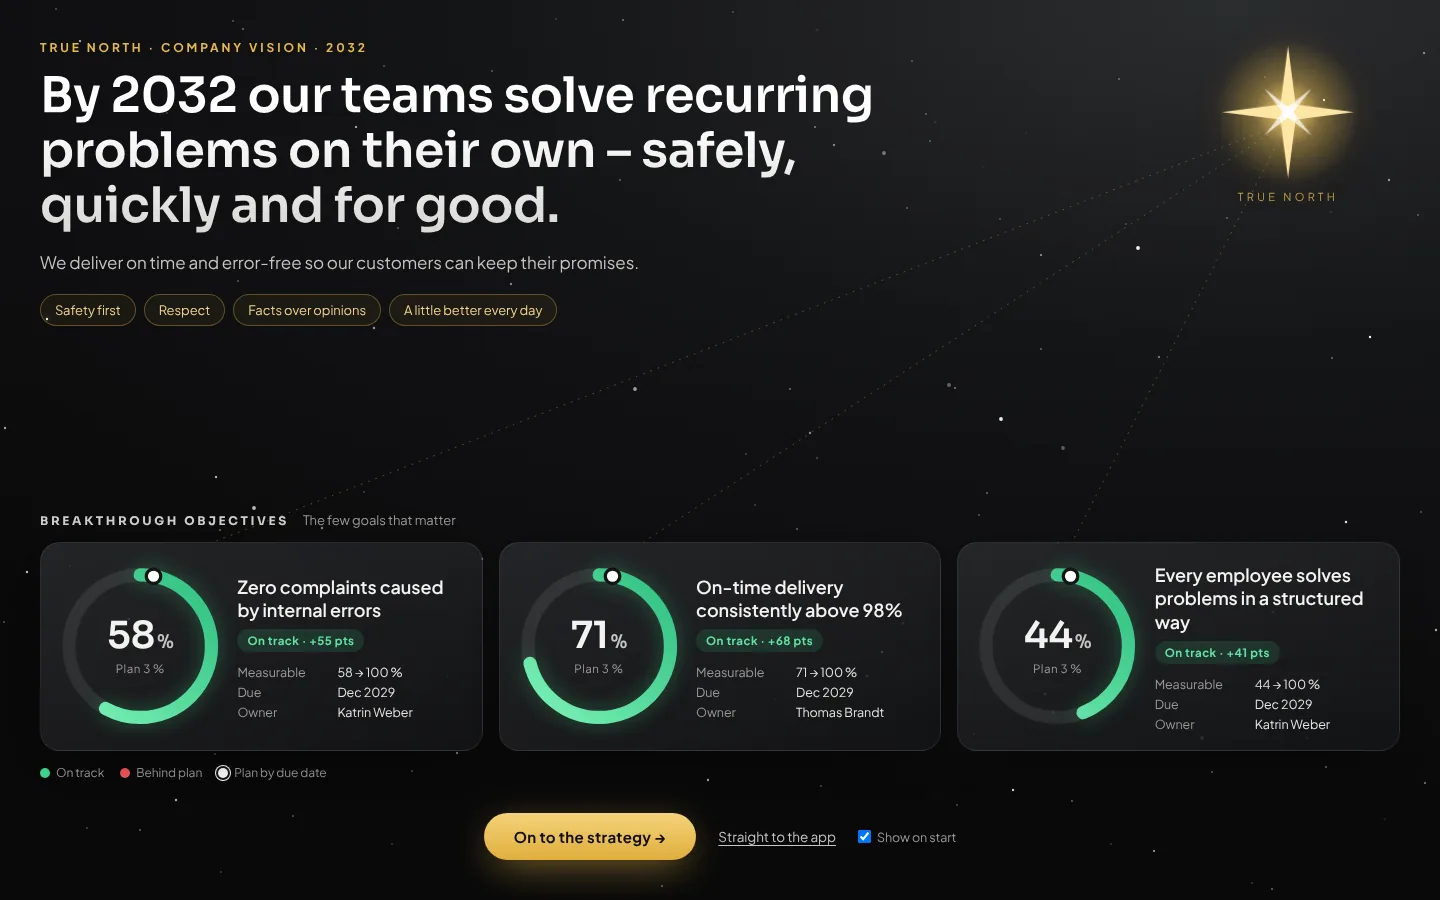
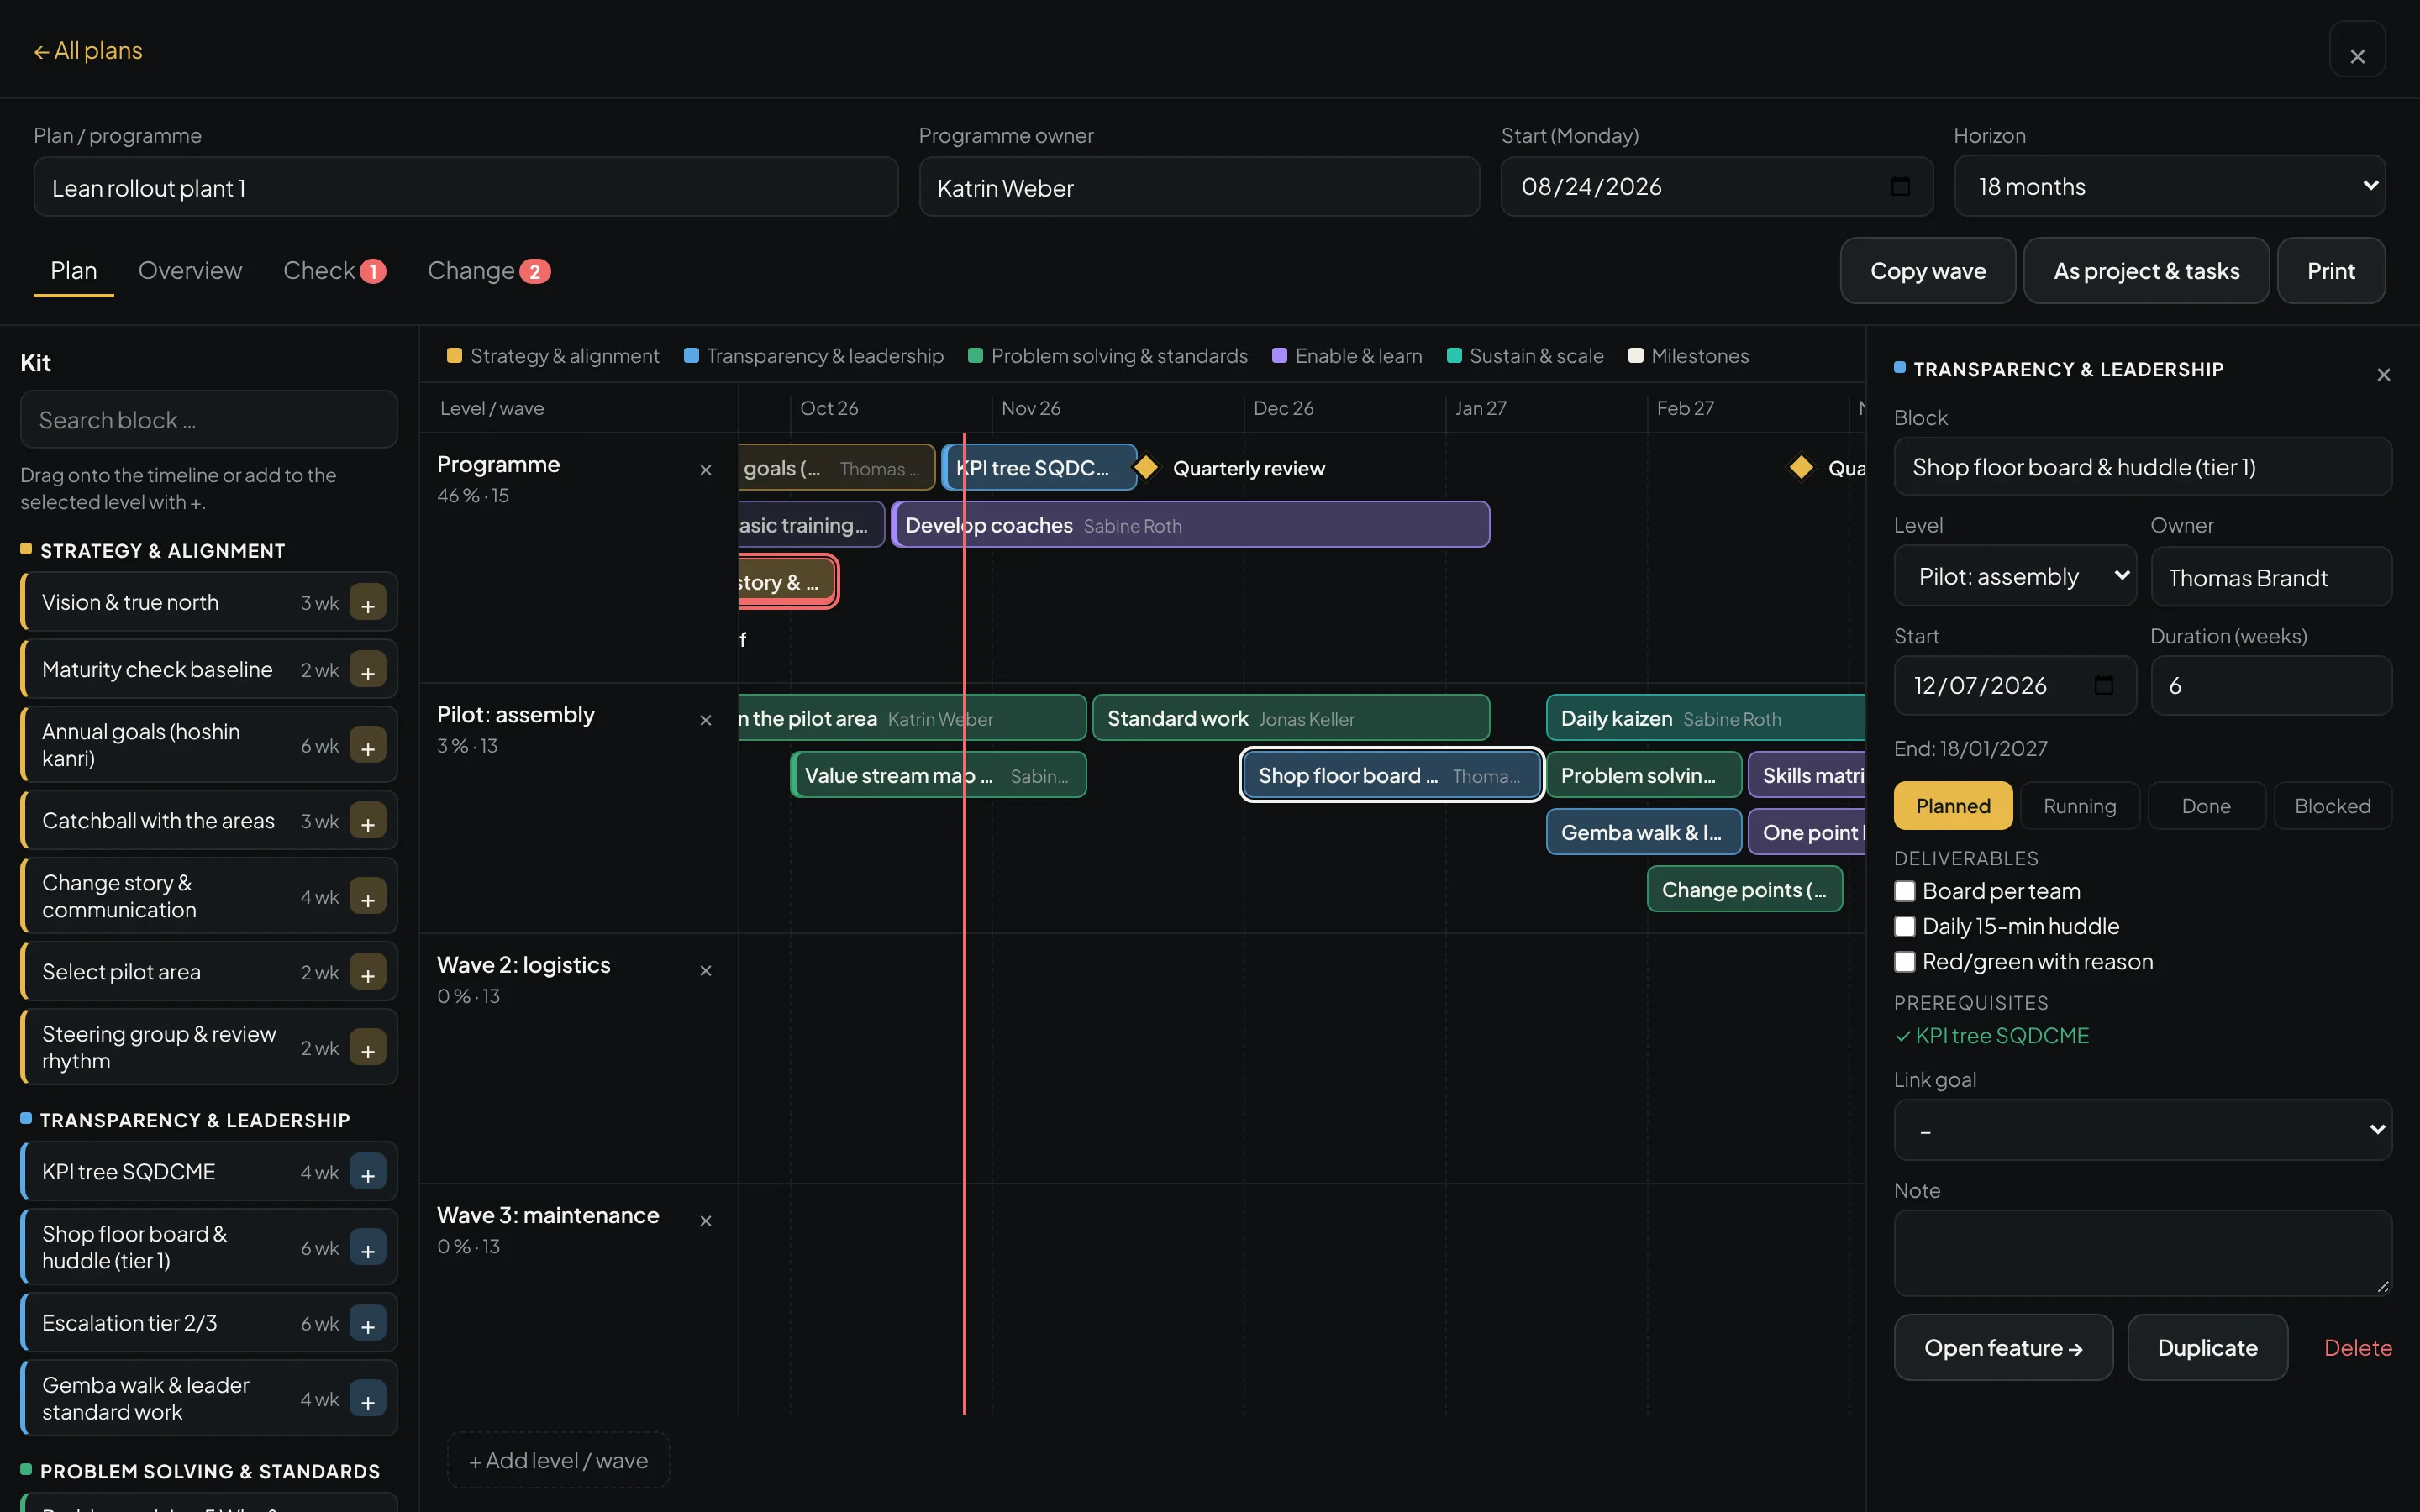
H·DELTA breaks company goals down level by level – following the proven Hoshin Kanri logic, step by step from top to bottom – right down to each person’s contribution and today. The gap between target and reality becomes visible every day, and smaller.
- True North5–10 yearsWhere the company wants to be in the long run.
- Breakthrough goals3–5 yearsThe few goals that move you towards True North.
- Annual goalsThis yearWhat has to be achieved this year.
- Department & teamQuarter to yearGoals aligned through catchball.
- My tasksThis weekActions with owners and due dates.
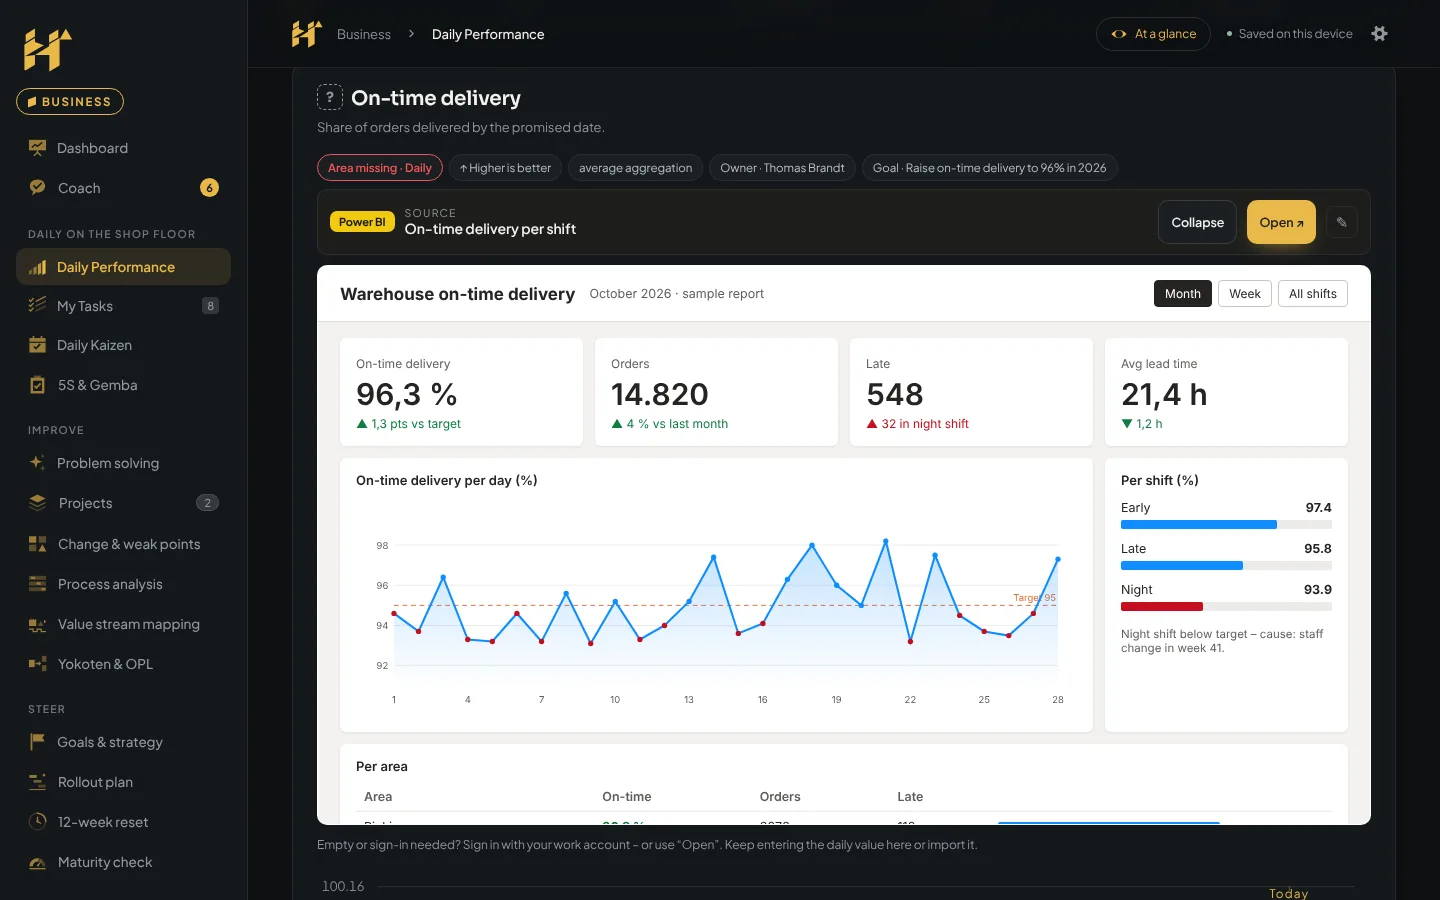
- Daily performanceTodayIs the KPI on target – and if not, why?
- Daily kaizen · Kaizen · 5 Why · Fishbone · A3FoundationDeviations become improvements – month by month with PDCA.
The core workflow
From a red KPI to a verified effect.
H·DELTA is built around this – everything else supports it. A team sees deviations the same day, finds the cause on site, implements actions with a name and a date, and closes the case only when the effect is proven.
- Step 1
01 · Detect
Daily results vs targetEvery miss is red at once and briefly explained. Critical KPIs open a case immediately, others after repeated red days.
- Step 2
02 · Understand
Cause, not guesswork5 Why and Ishikawa where it happens – with evidence, until the cause lies in the process.
- Step 3
03 · Act
Containment and countermeasureContain, fix, use an A3 for bigger issues – every action with an owner and a date.
- Step 4
04 · Sustain
Only the effect closes itA case closes only with verified evidence. What works becomes the standard and is shared as a one point lesson.
12-week reset
Twelve weeks with a roadmap – and a report that shows the impact.
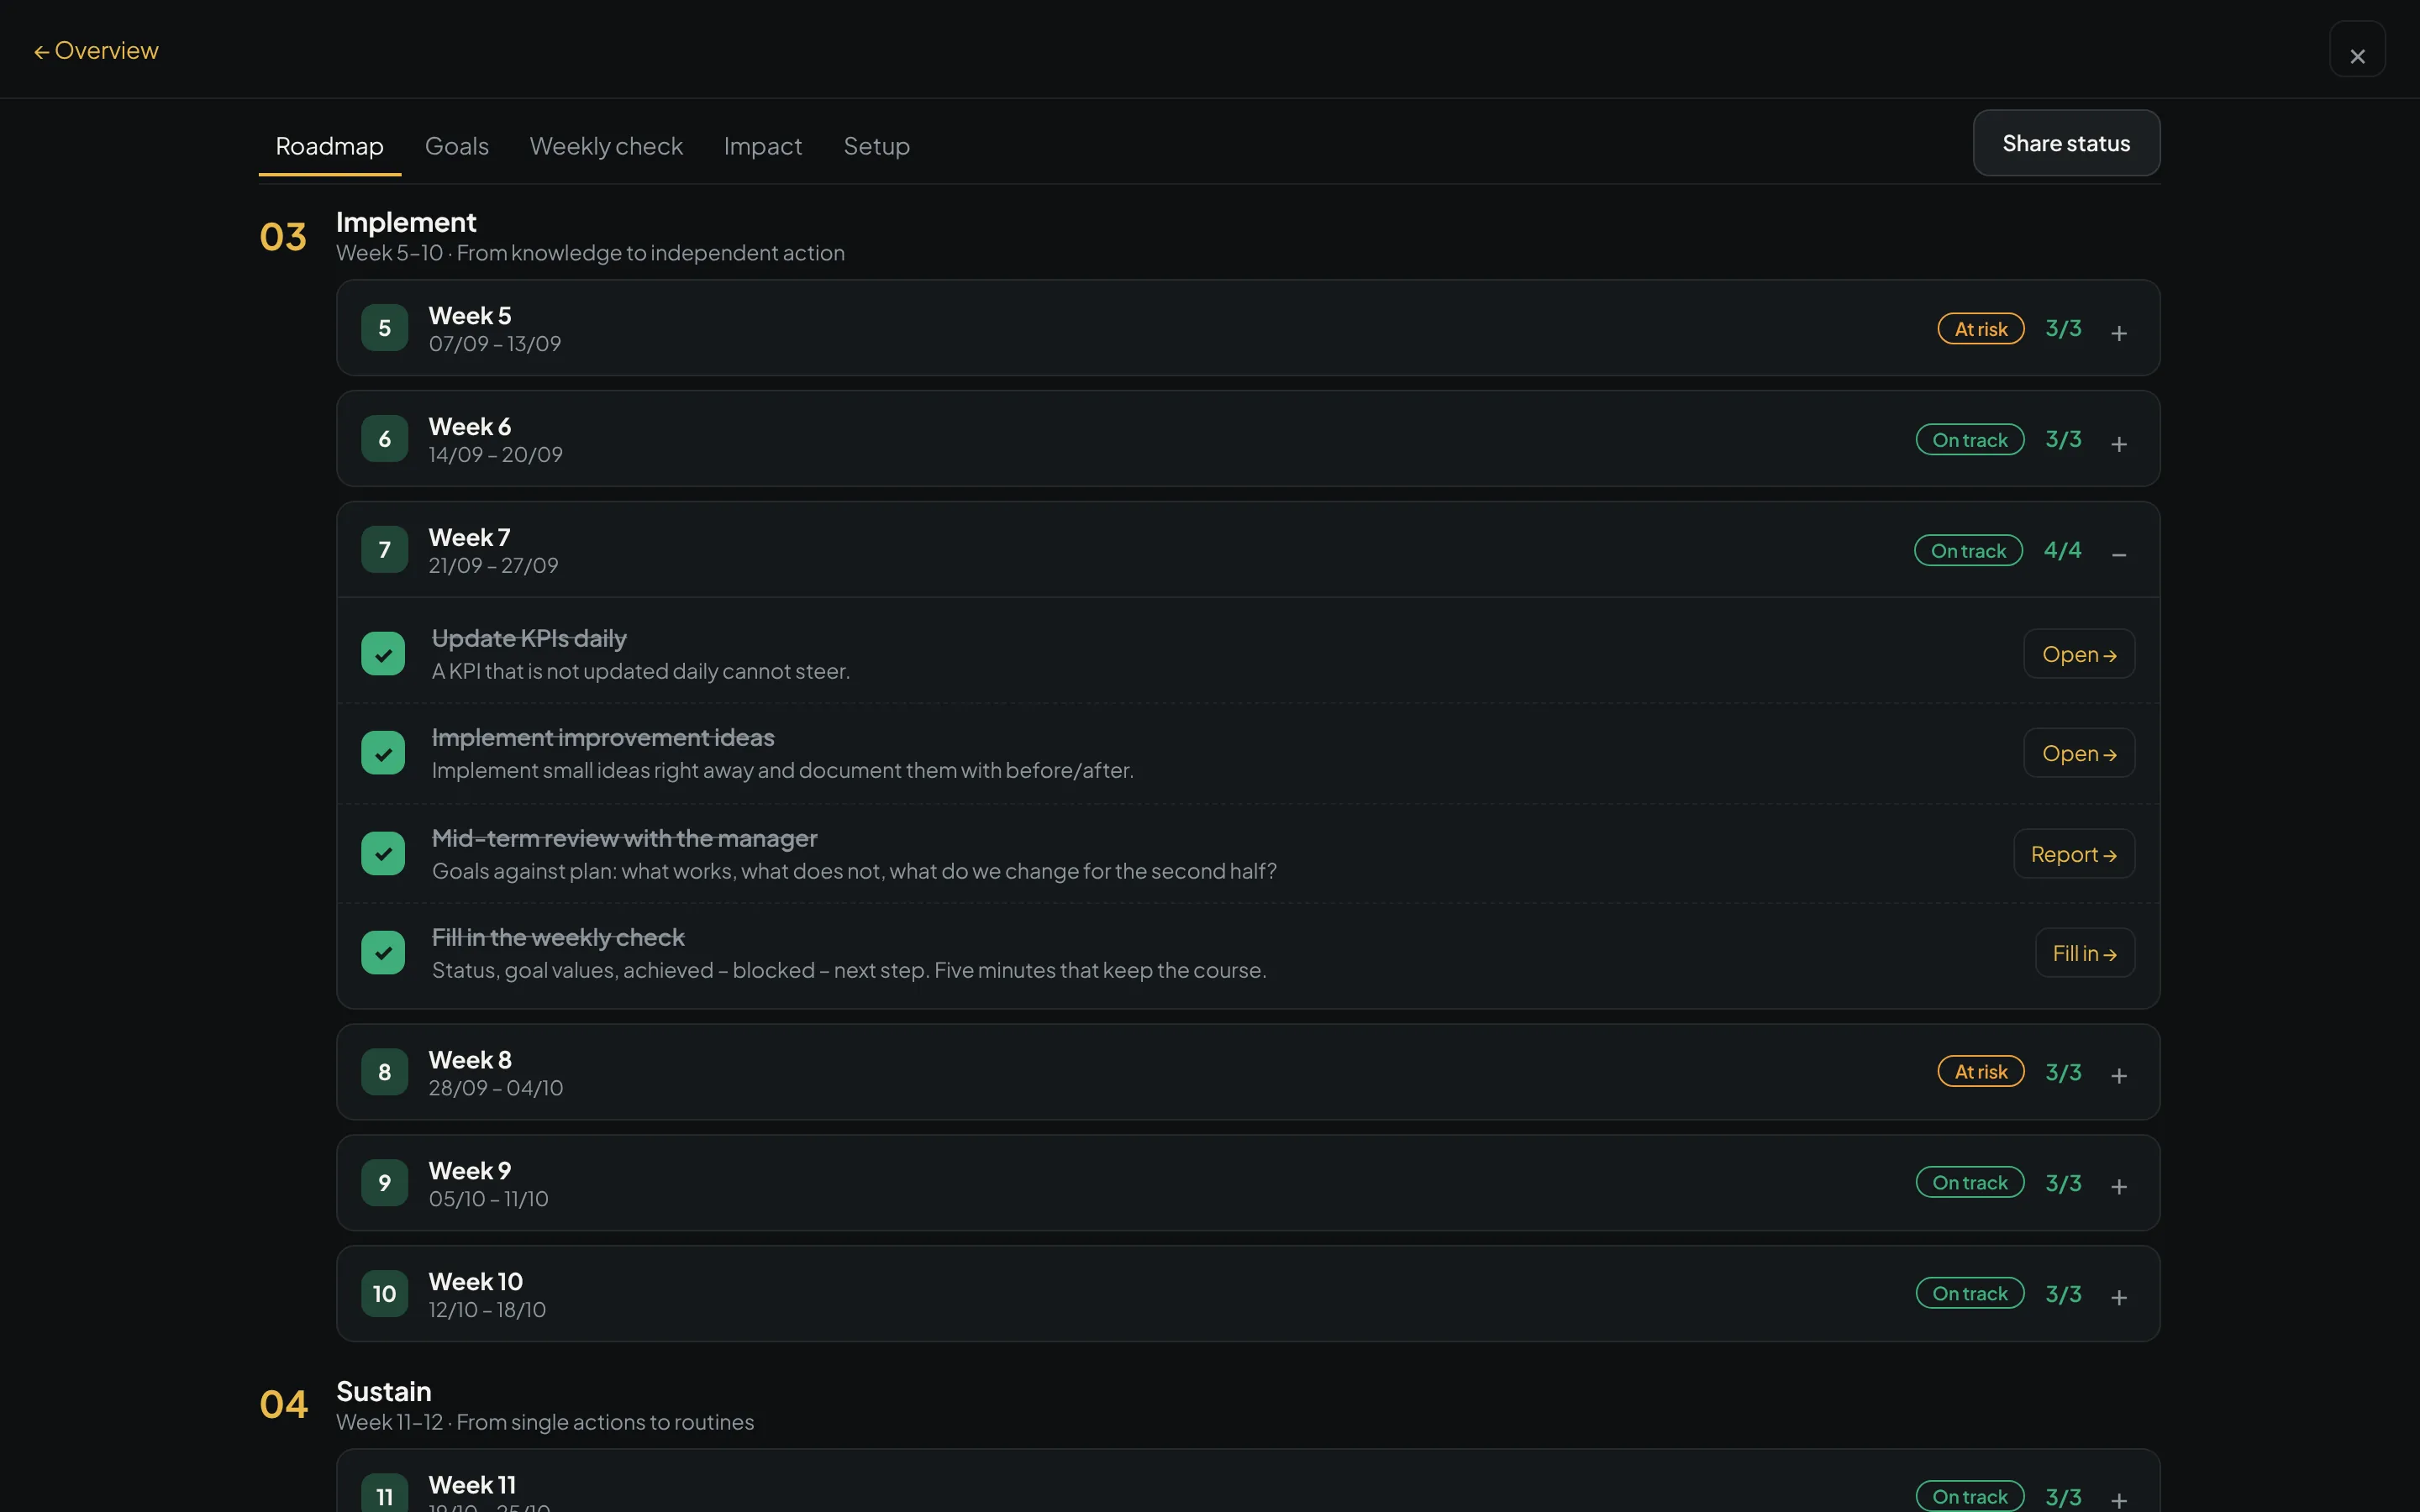
The reset is built into the app: a start wizard turns the starting point, focus areas and goals into a week-by-week roadmap – through understand, focus, implement and sustain.
- Start wizard: team or pilot area, manager, starting point, 2–3 focus areas and up to three measurable goals
- Roadmap with concrete steps per week and a jump to the matching function – many steps are detected by the app itself
- Weekly check in five minutes: status, team mood, goal values, achieved – blocked – next step
- Impact report as PDF: goals before and after, maturity at start and re-check, implementation in the period, successes and next steps
- Cockpit for several teams – and status codes teams use to send their progress to their coach
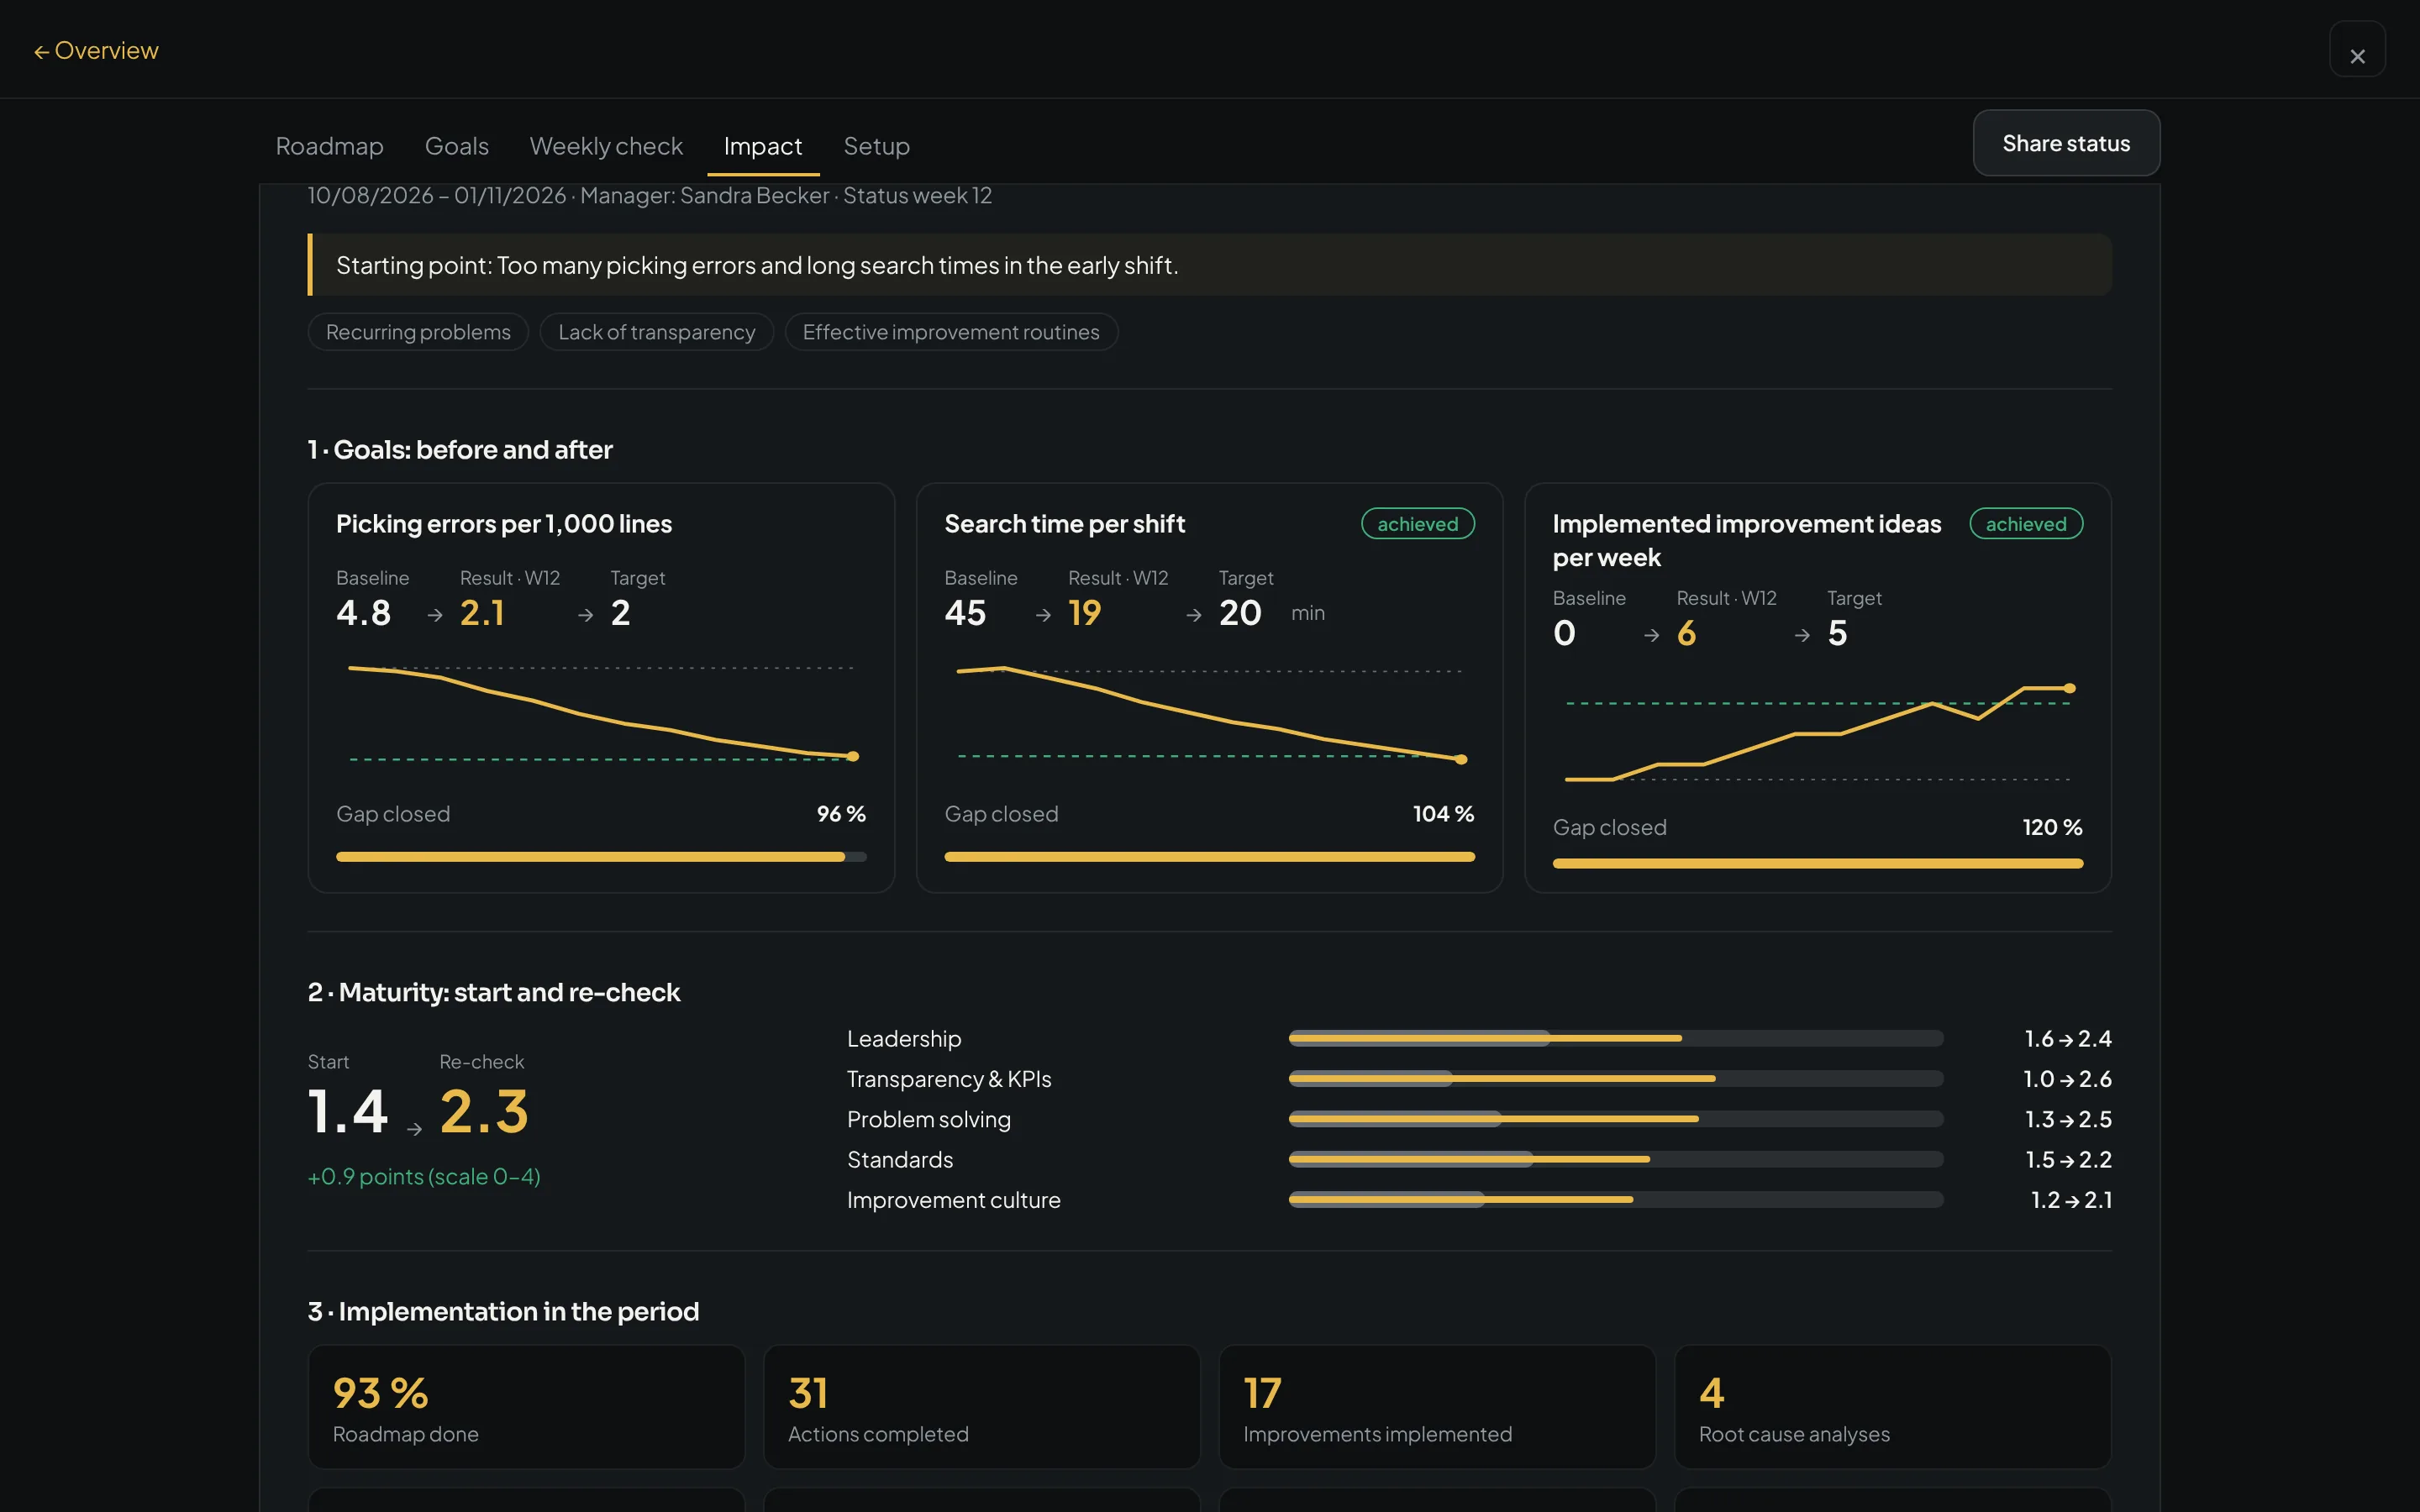
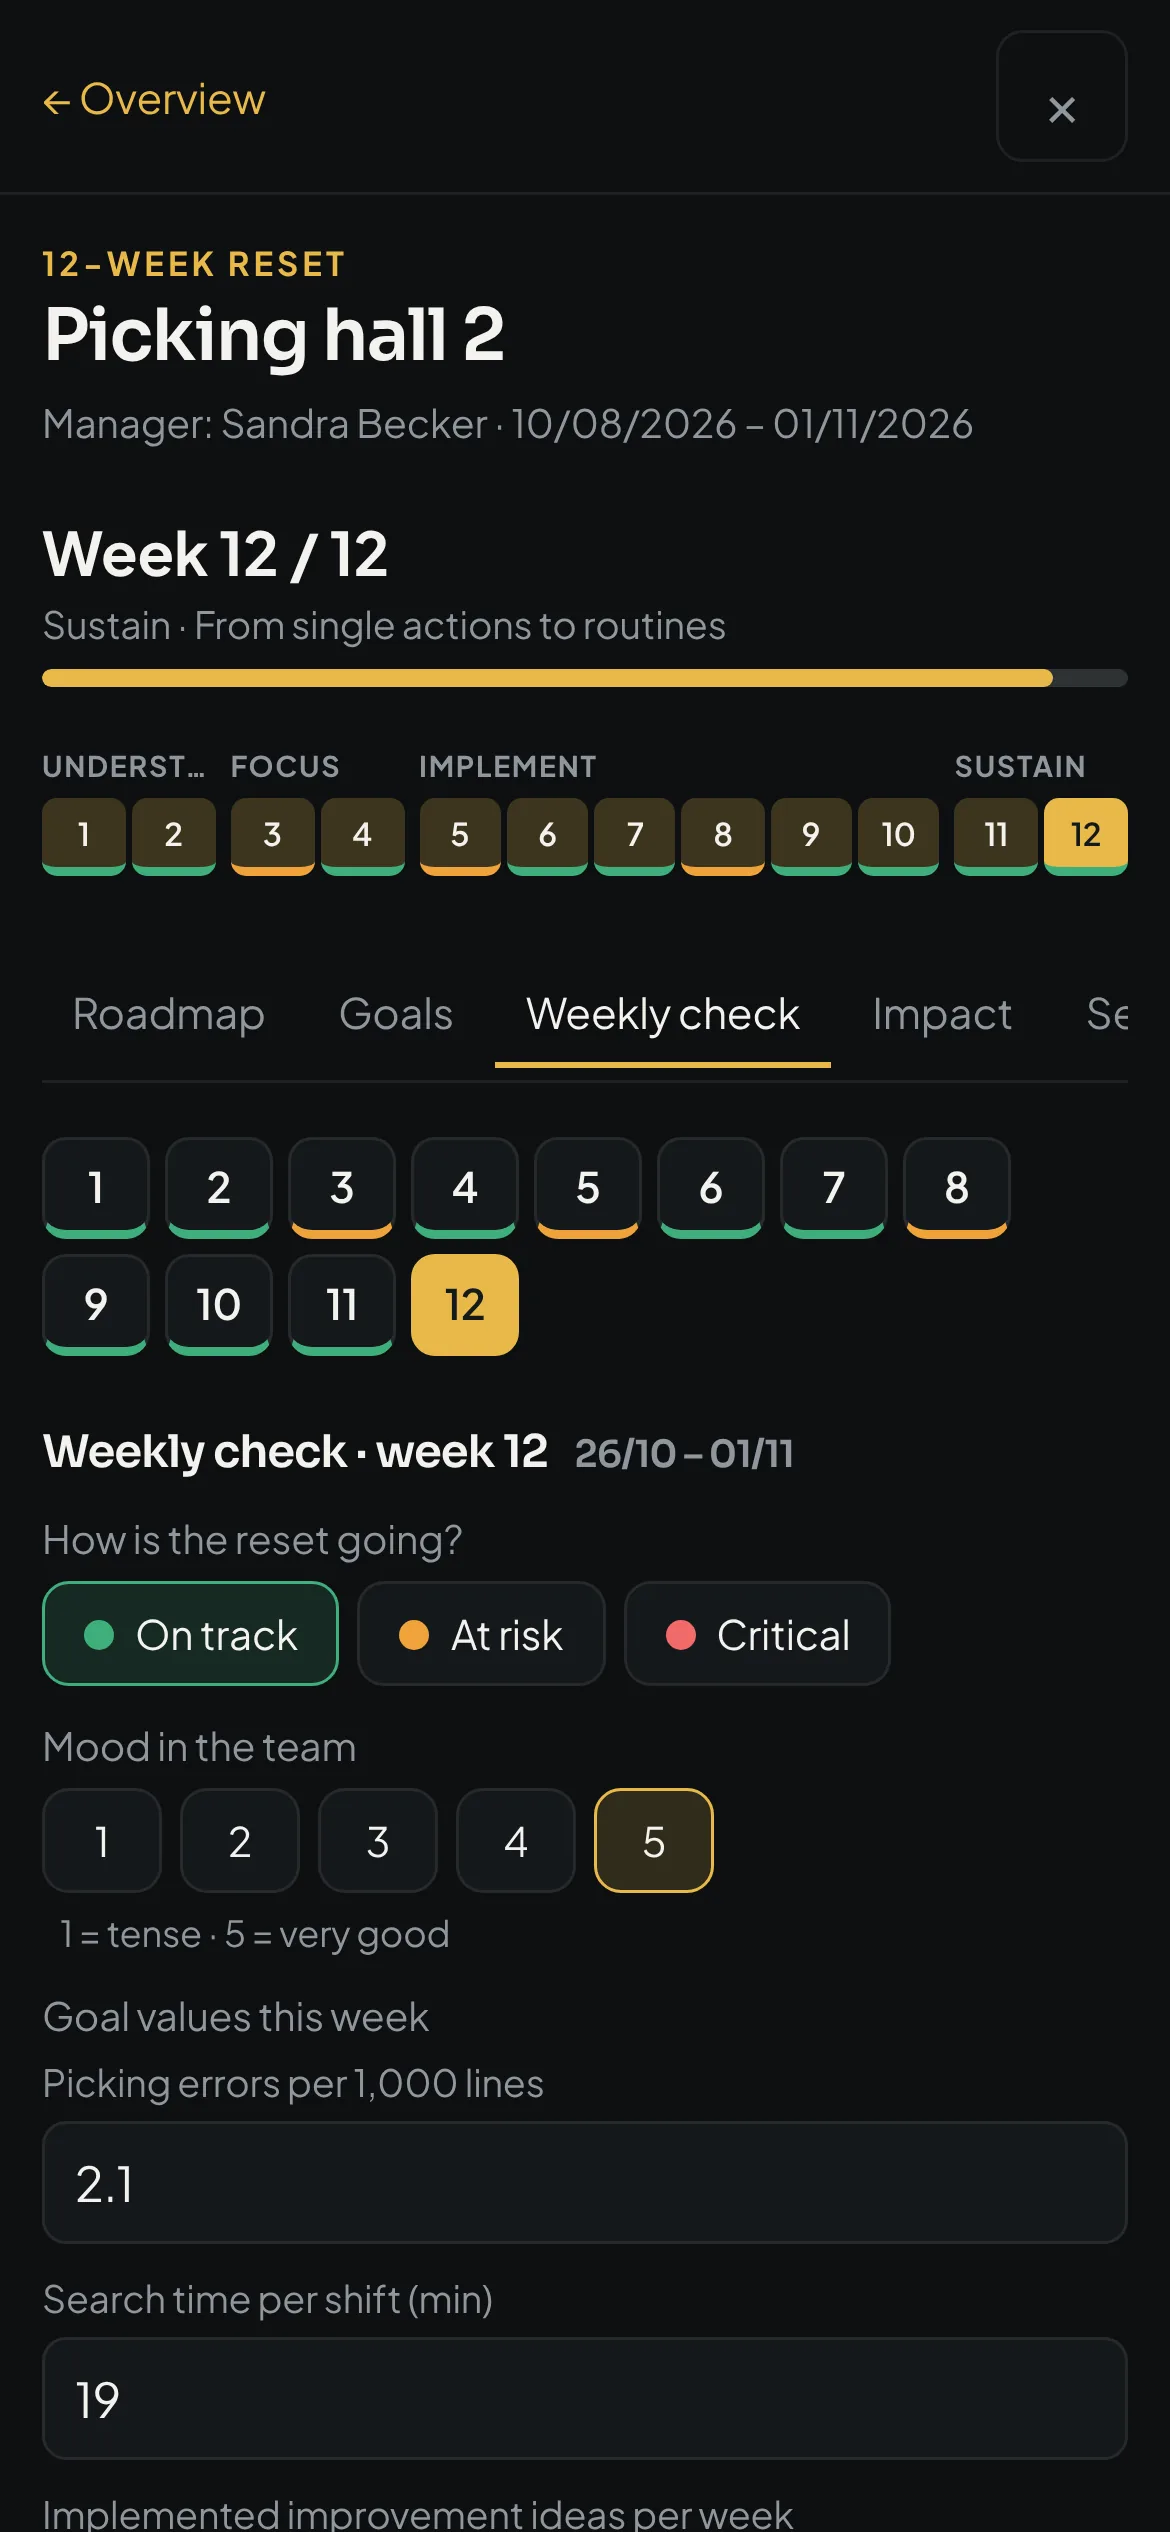
Sample data.
A quick look
A glimpse inside.
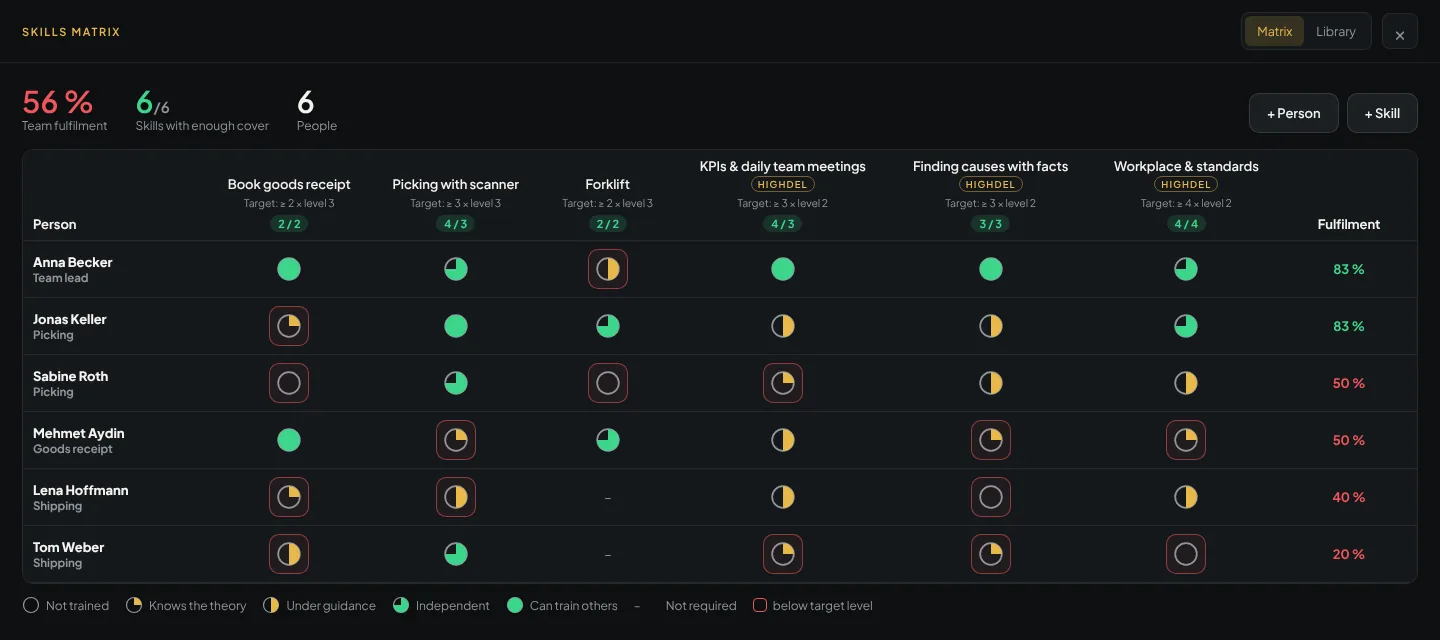
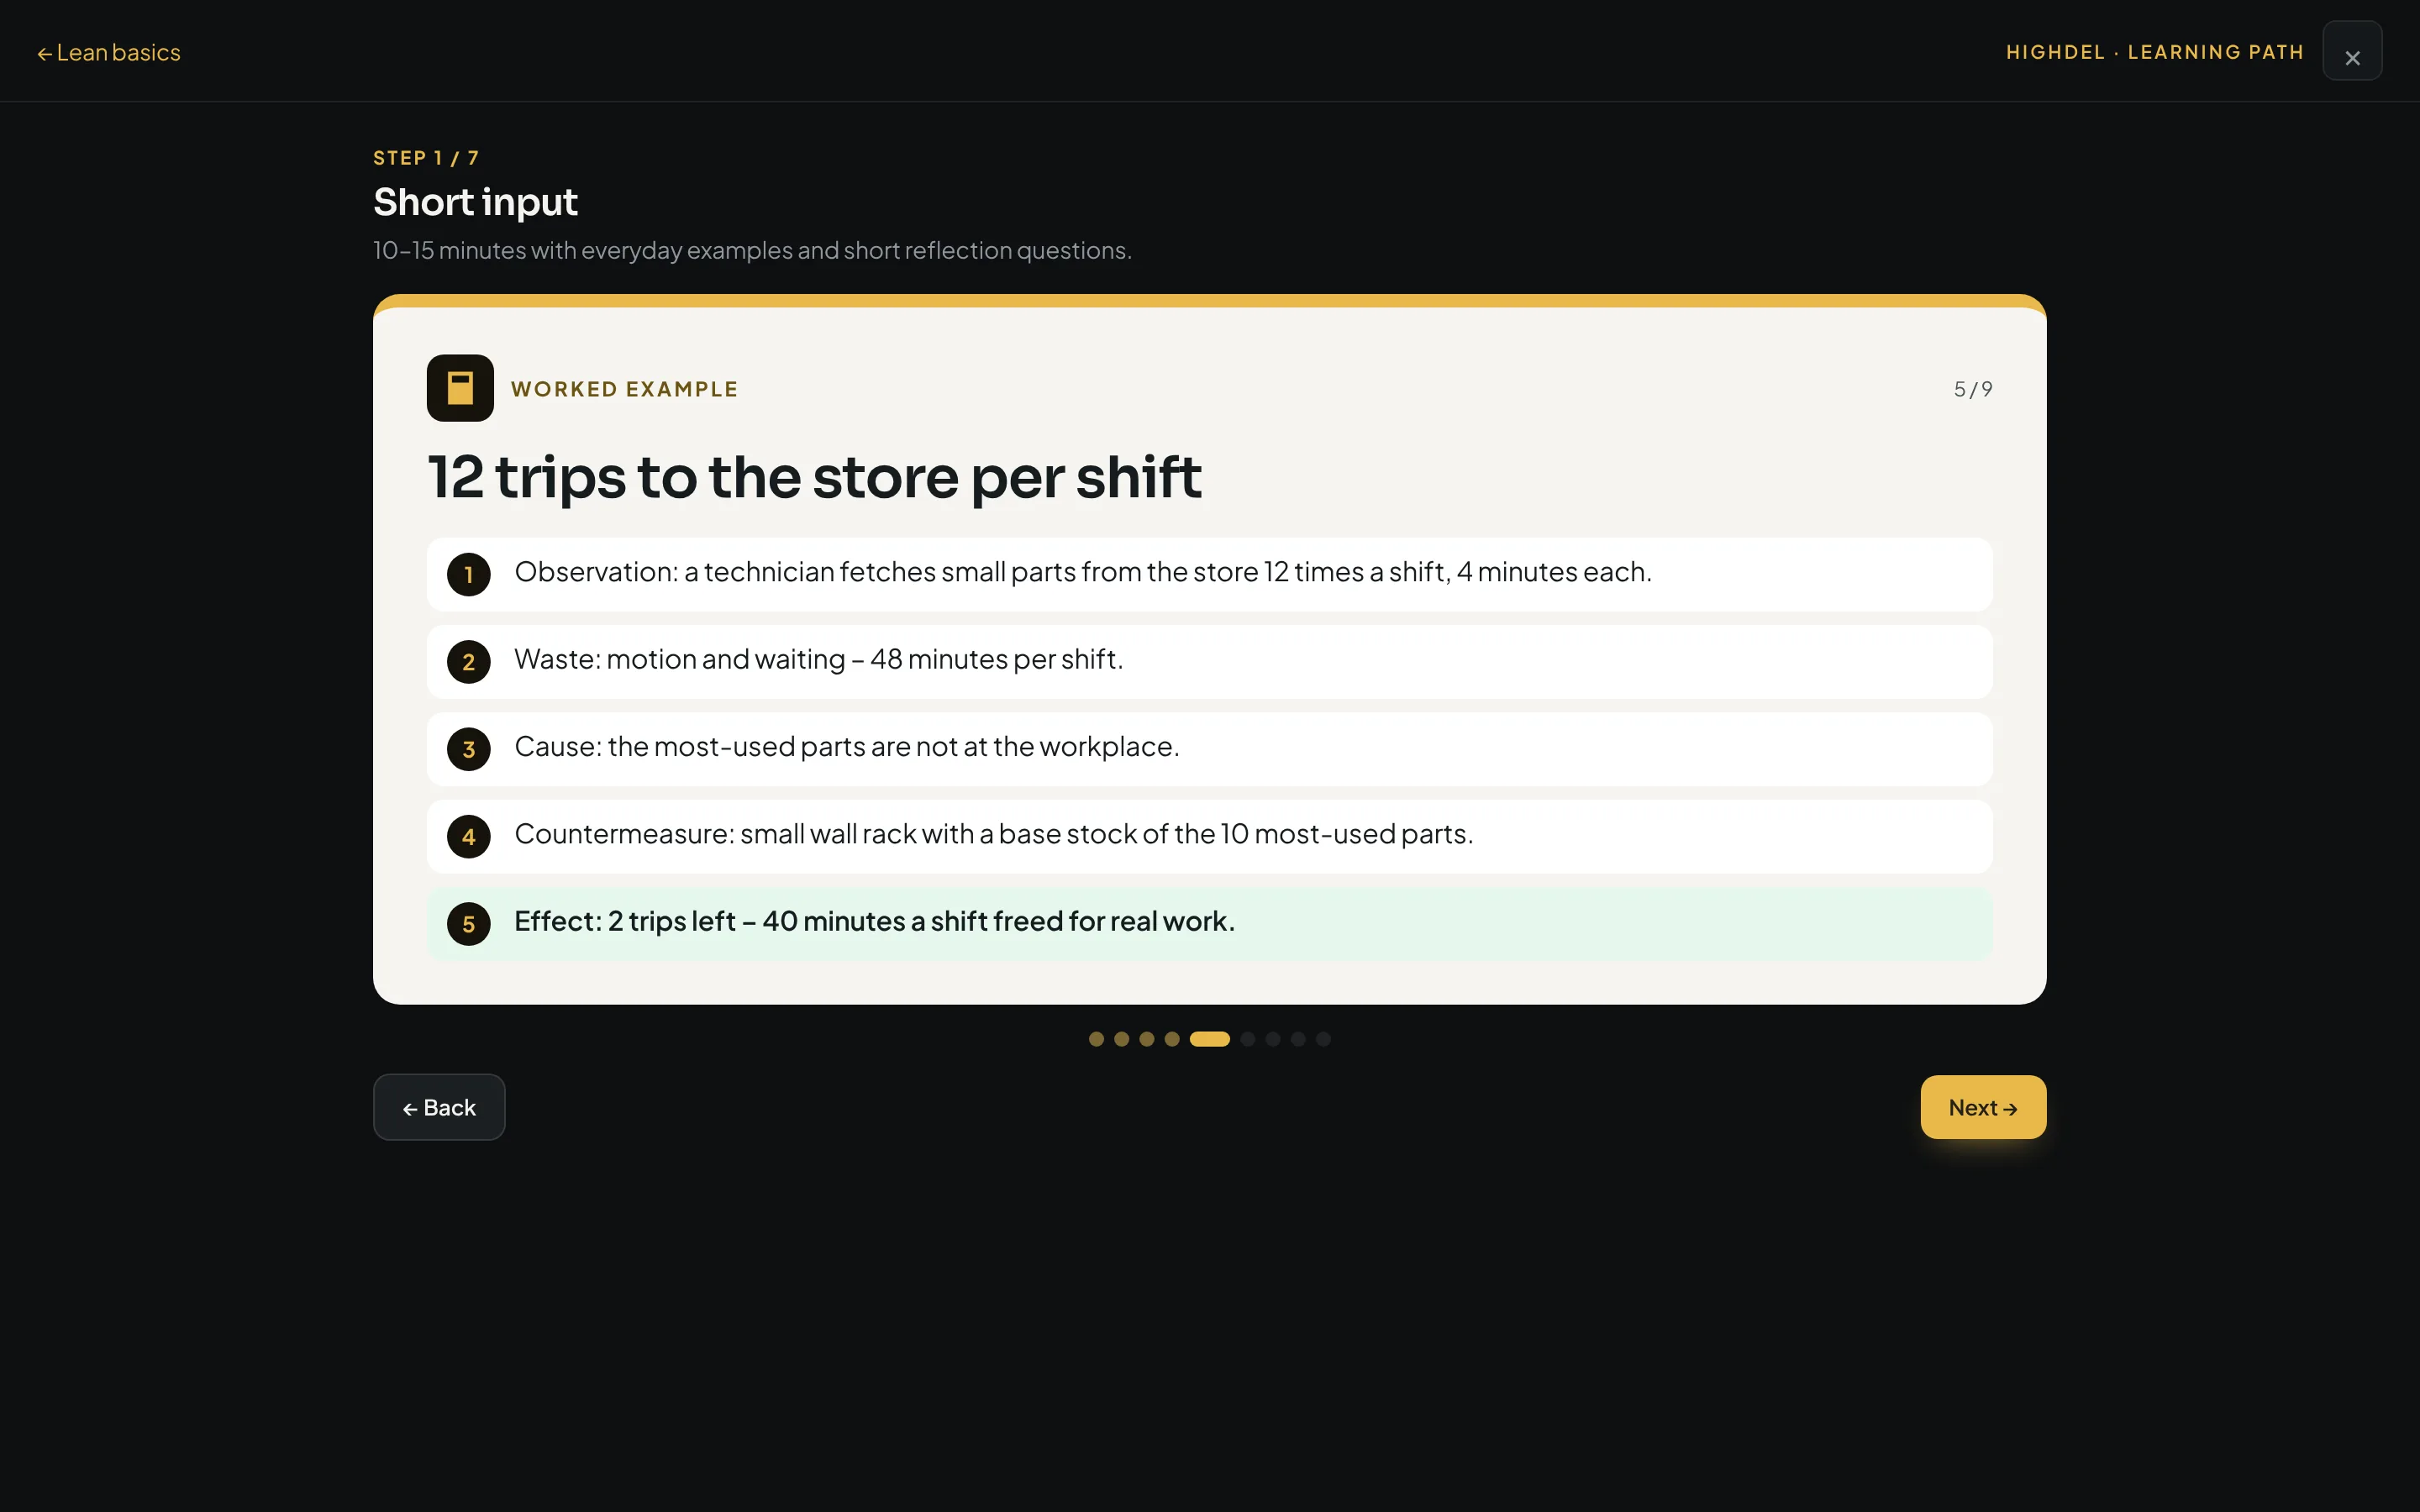
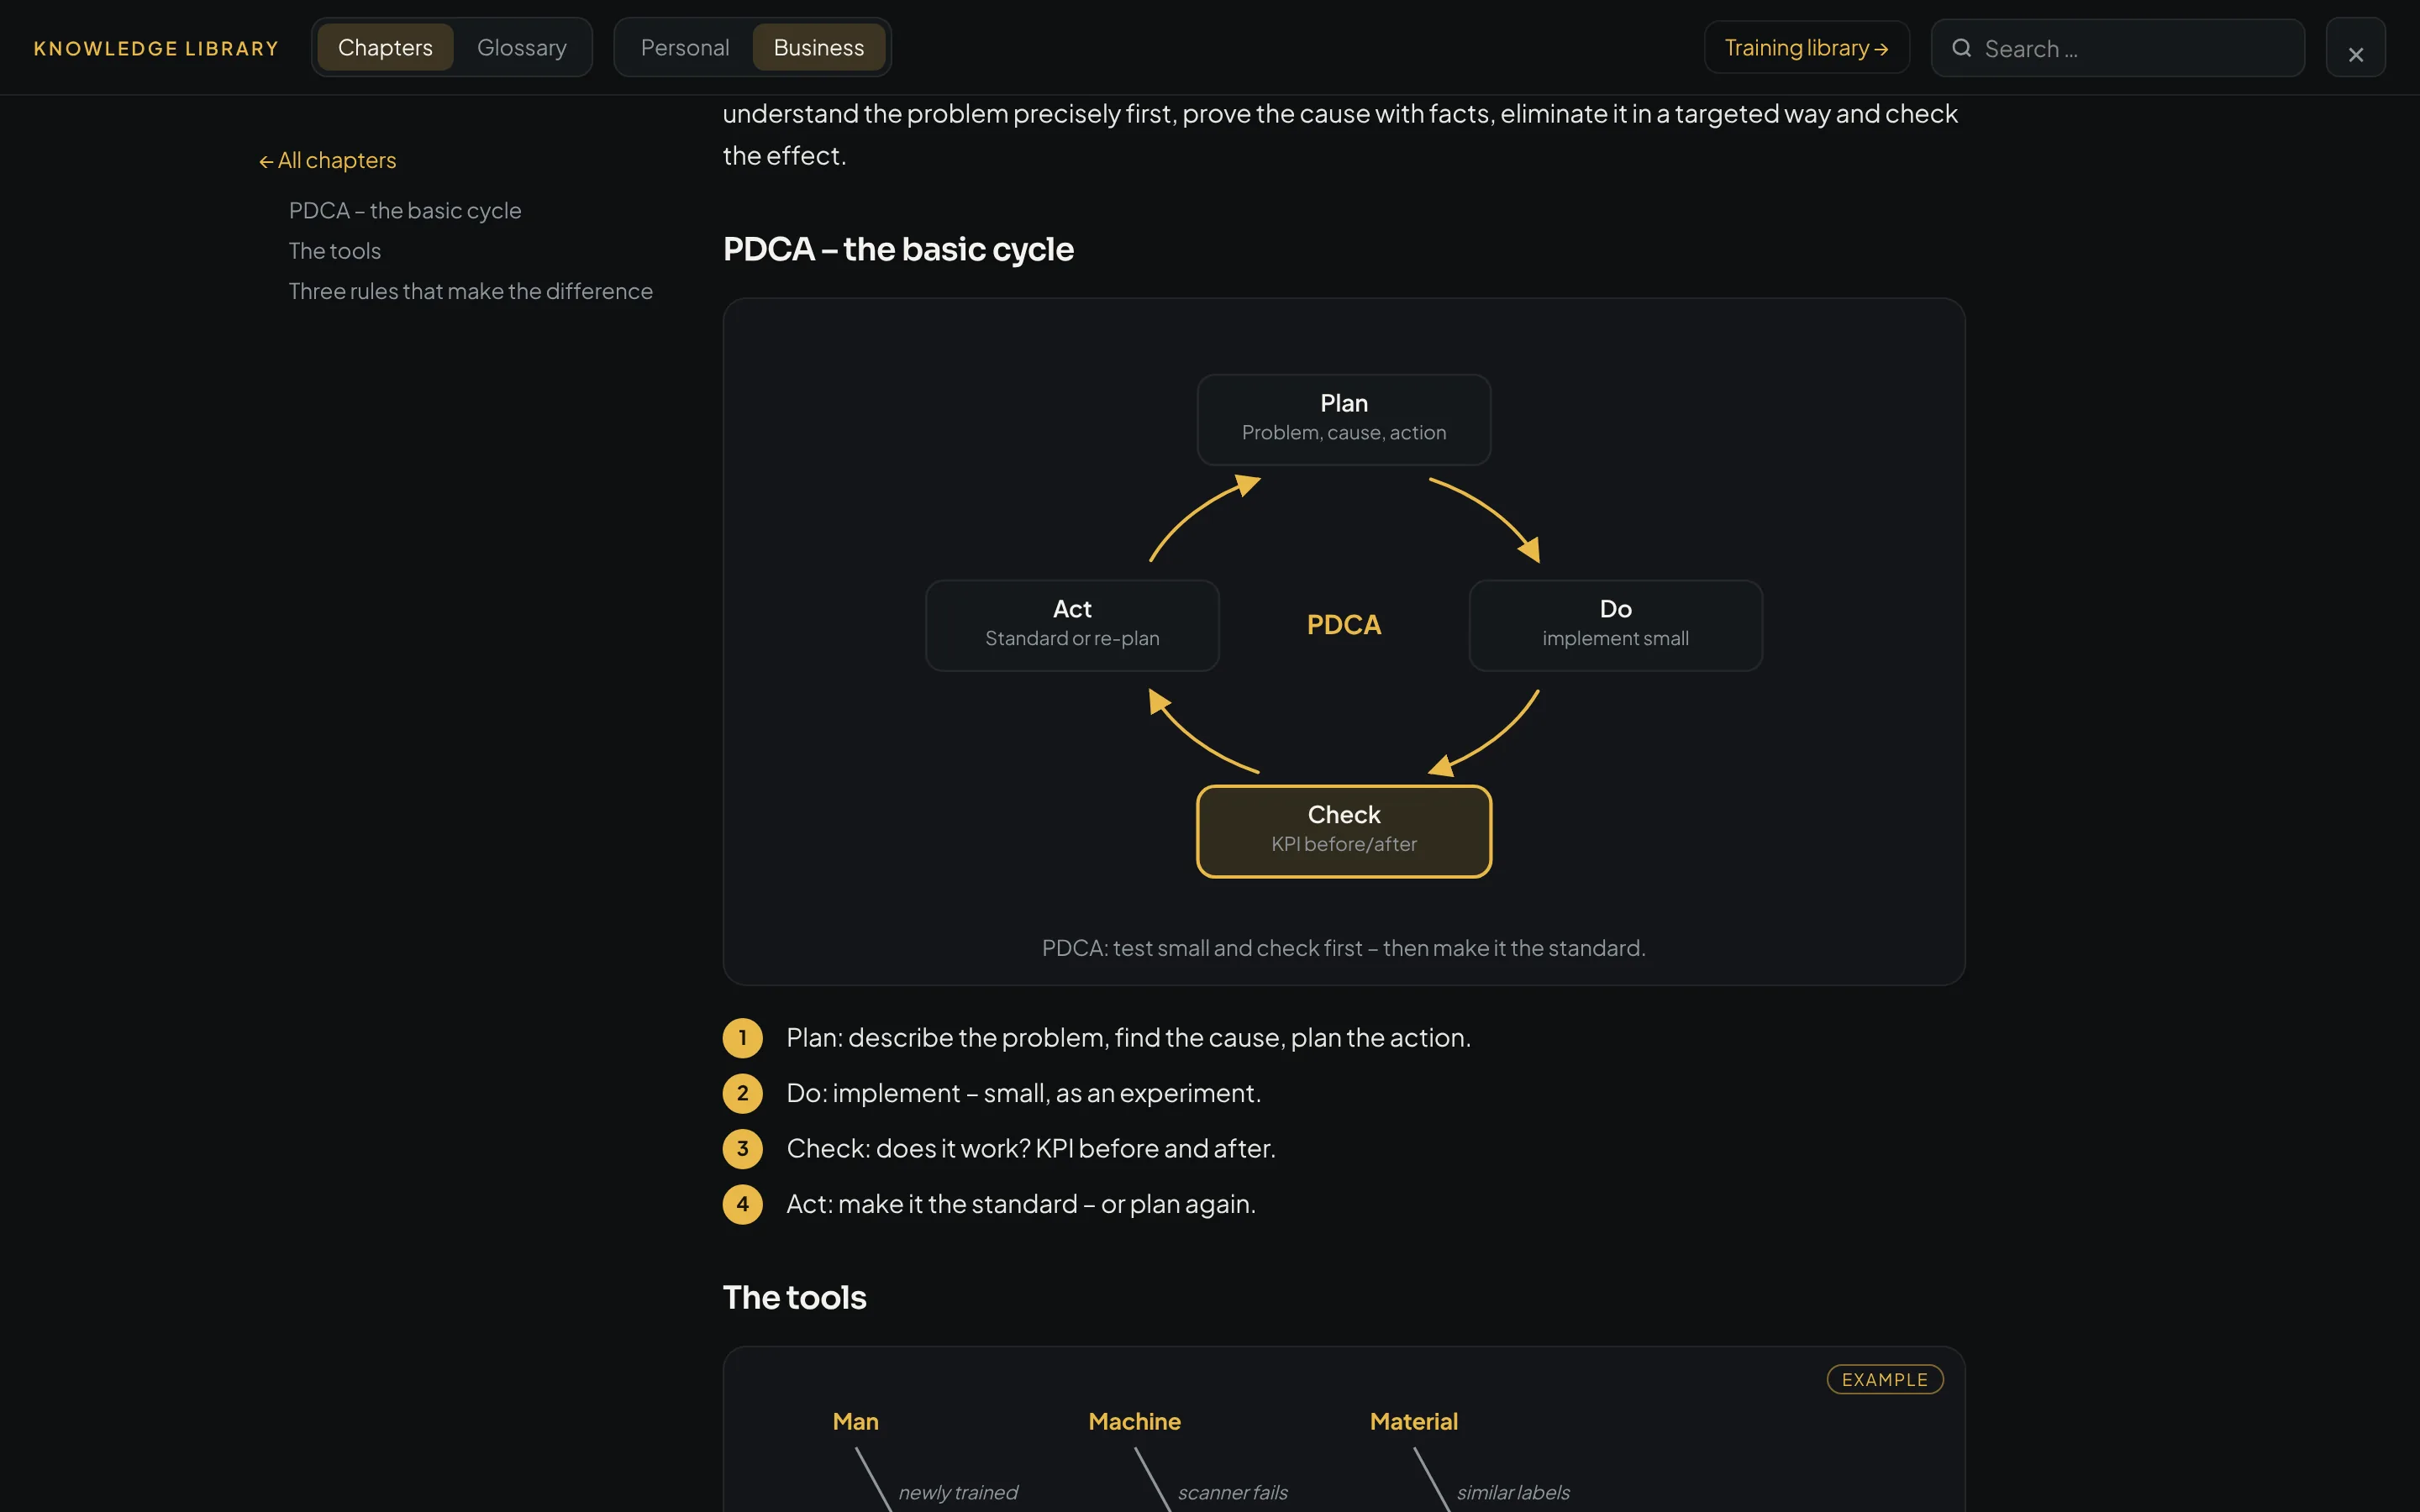
Eight short screen recordings with sample data – from the deviation case to the maturity check.
Screen recordings with sample data.
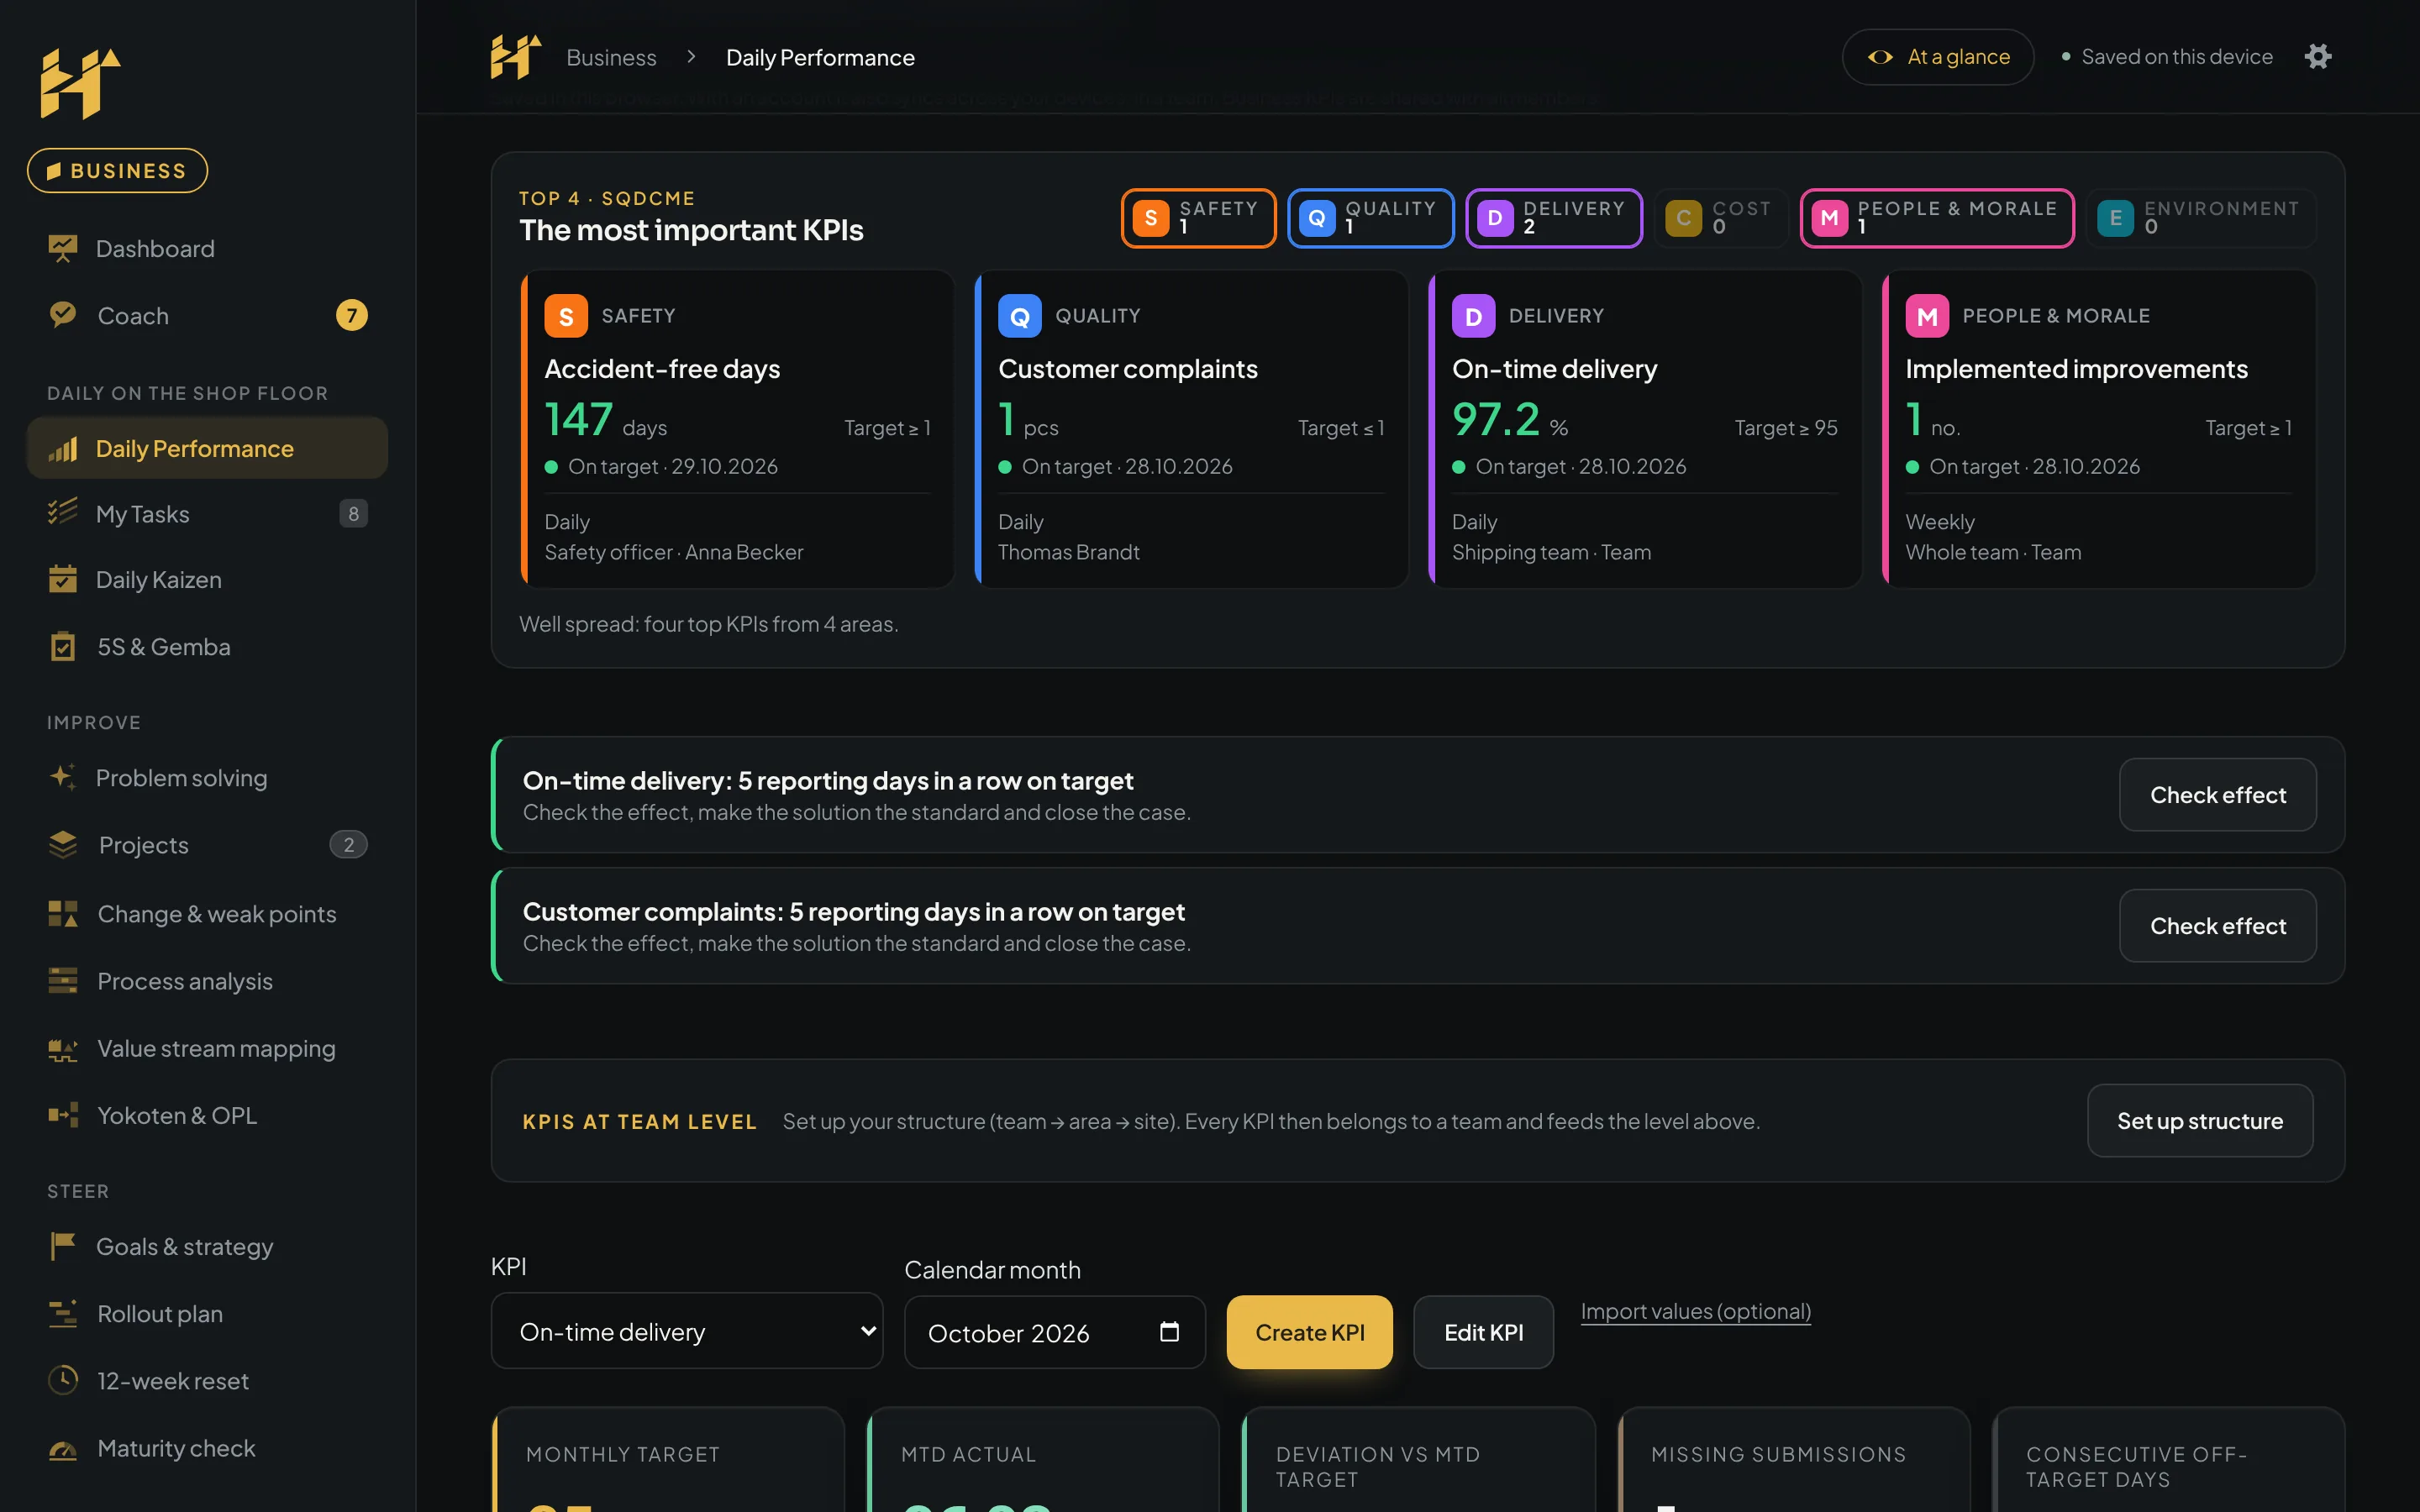
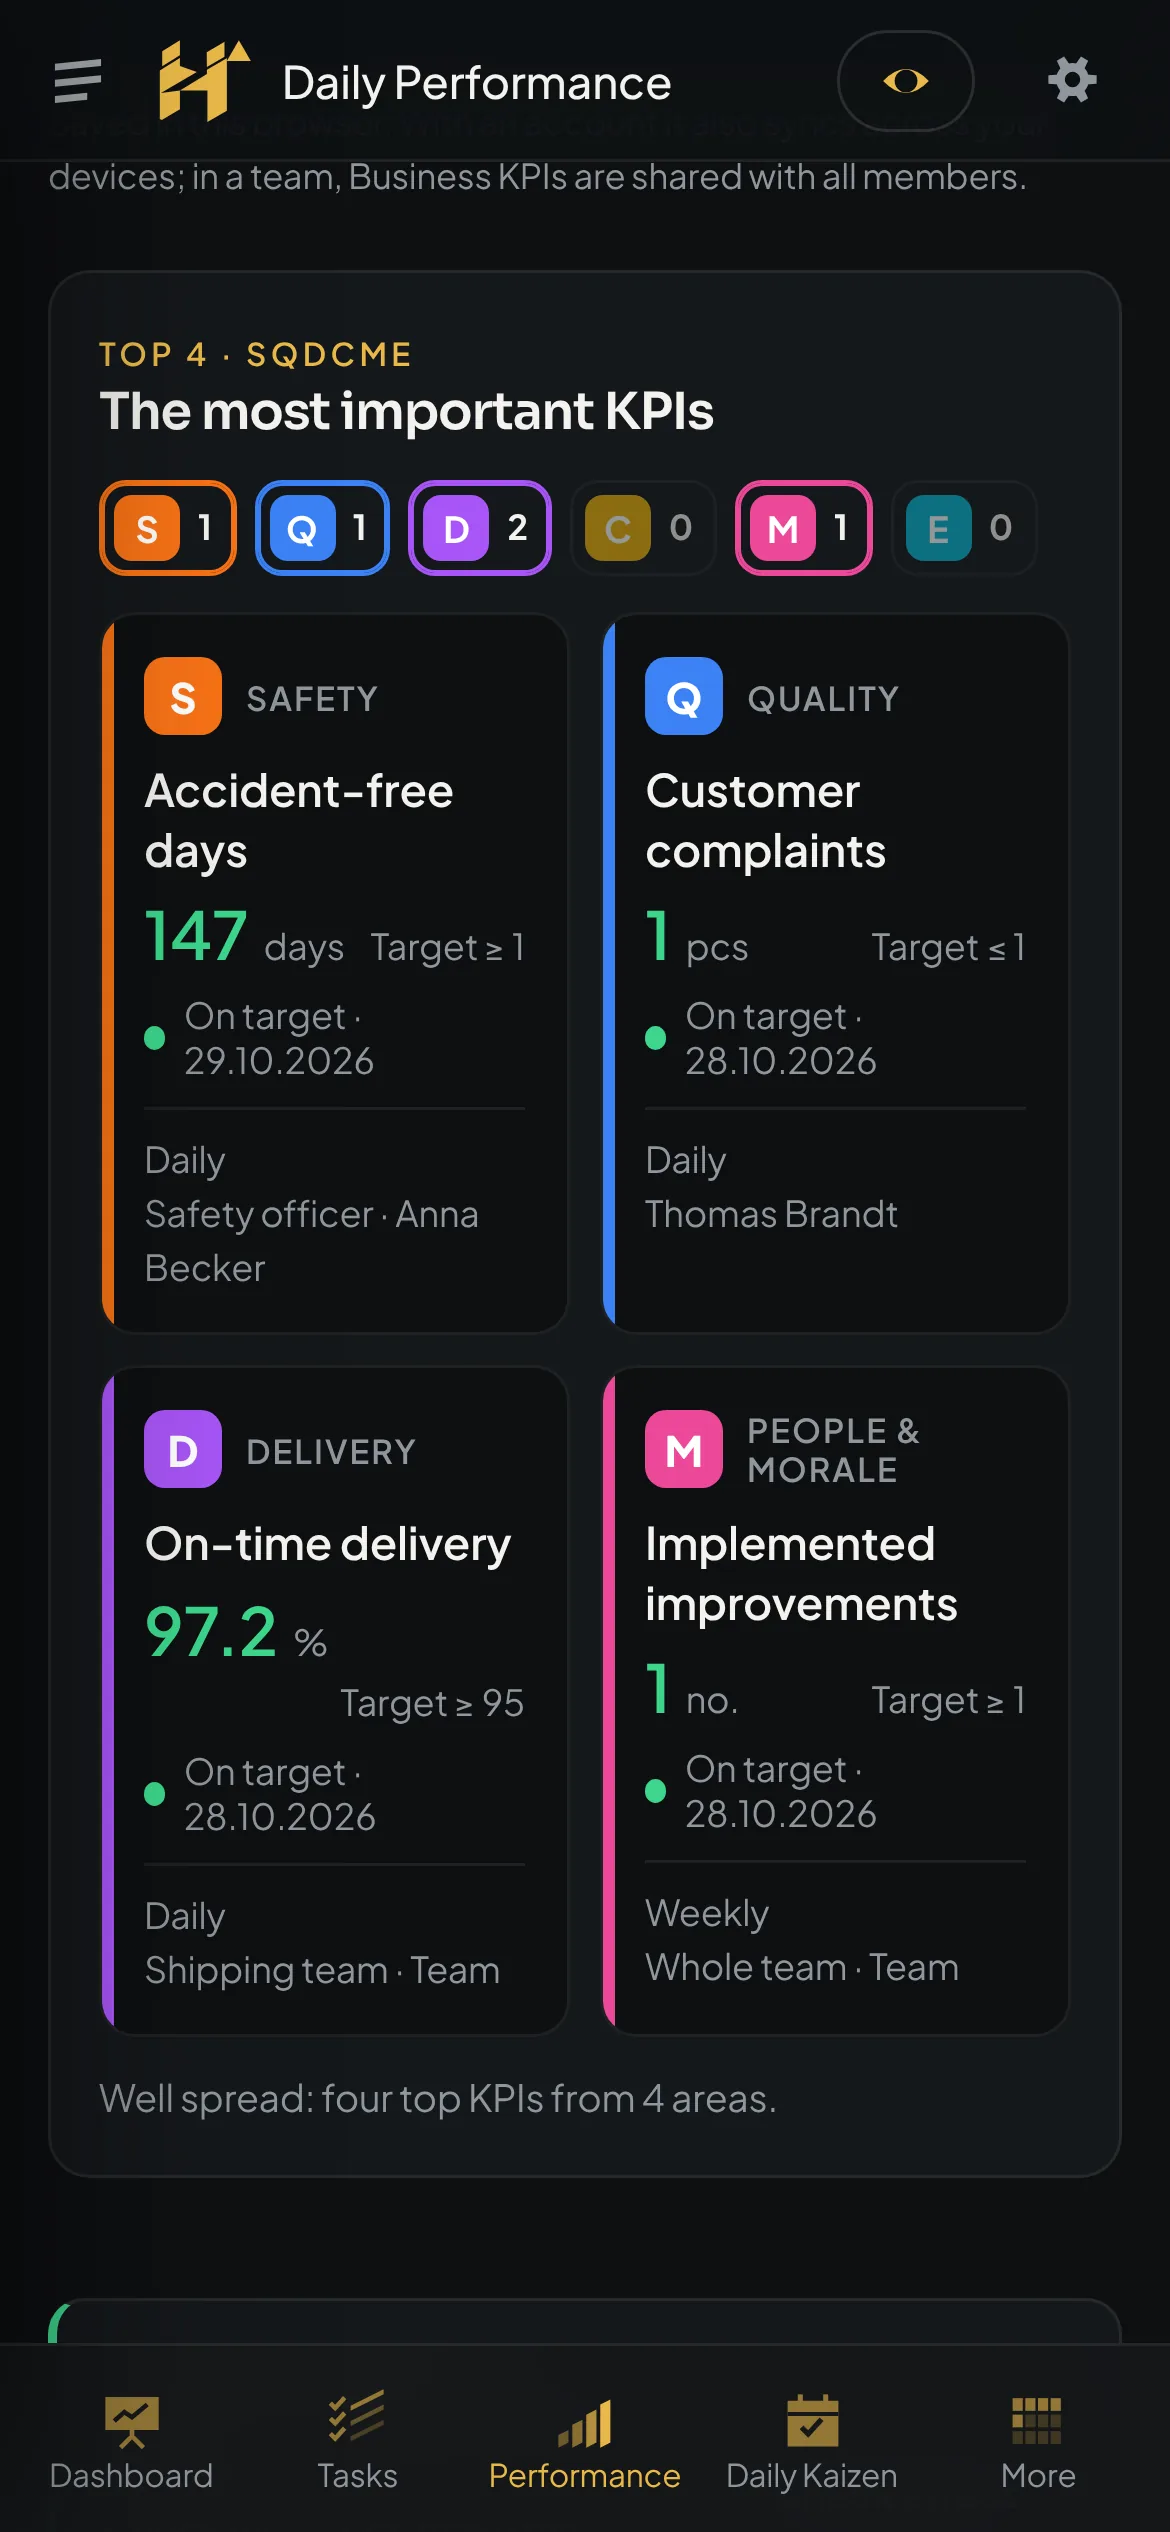
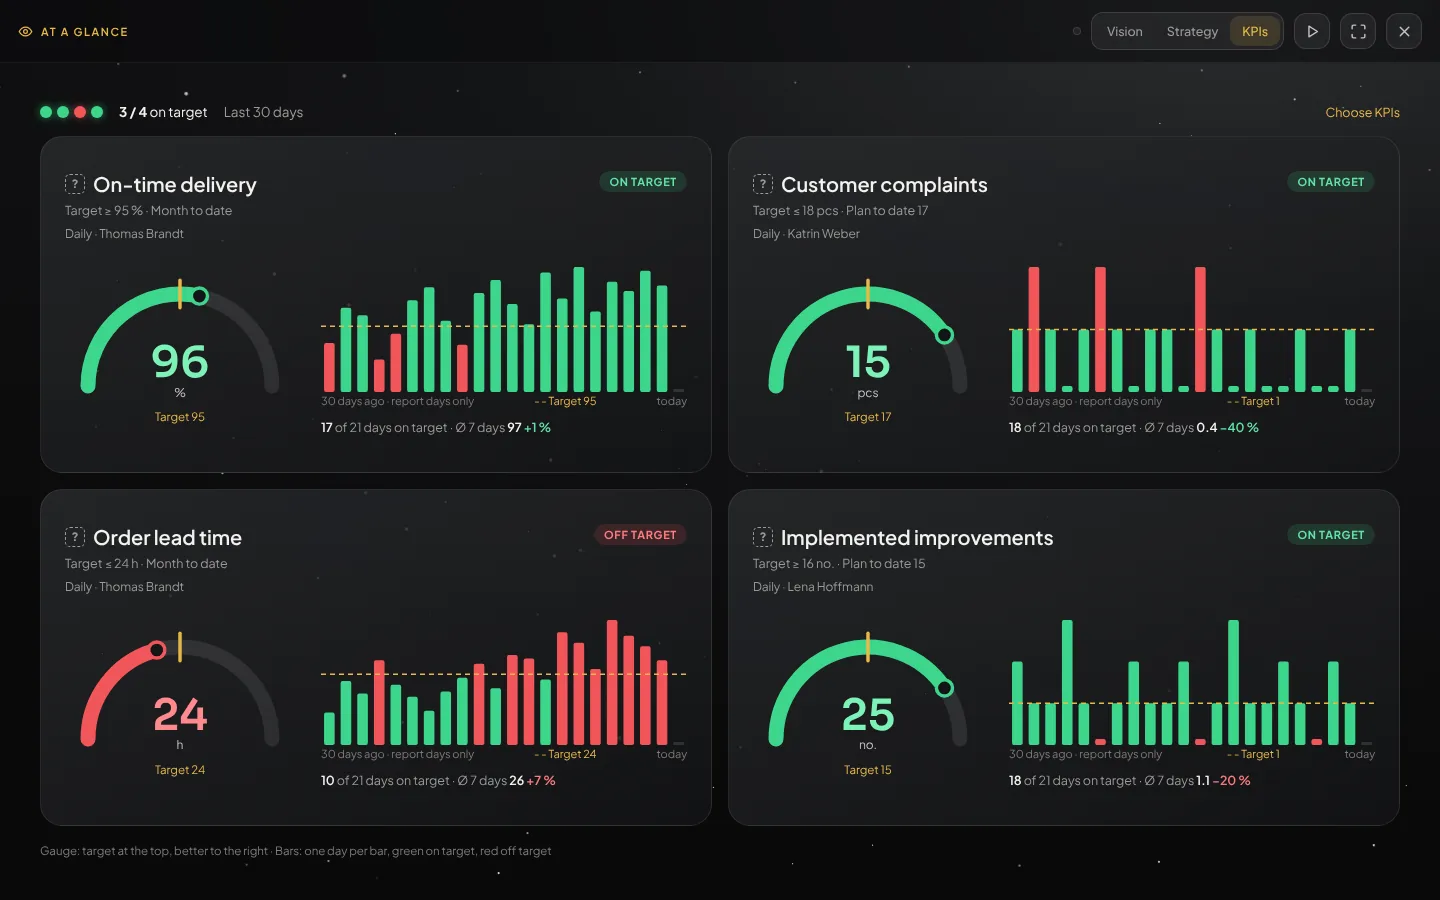
KPIs by SQDCME
Four KPIs that matter – broadly spread.
Following proven lean practice, every KPI belongs to an area: safety, quality, delivery, cost, people & morale or environment. The four most important ones sit at the top – ideally from different areas.
- Every KPI carries its letter: S, Q, D, C, M or E
- Top 4 as a board and in “At a glance” – with a hint when areas double up
- At every KPI: how often it is updated and who is responsible – person or team
- As many further KPIs in the detail as you need
- KPIs belong to the team: structure of team, area and plant, area values roll up automatically
- What a team cannot solve alone escalates to the next level
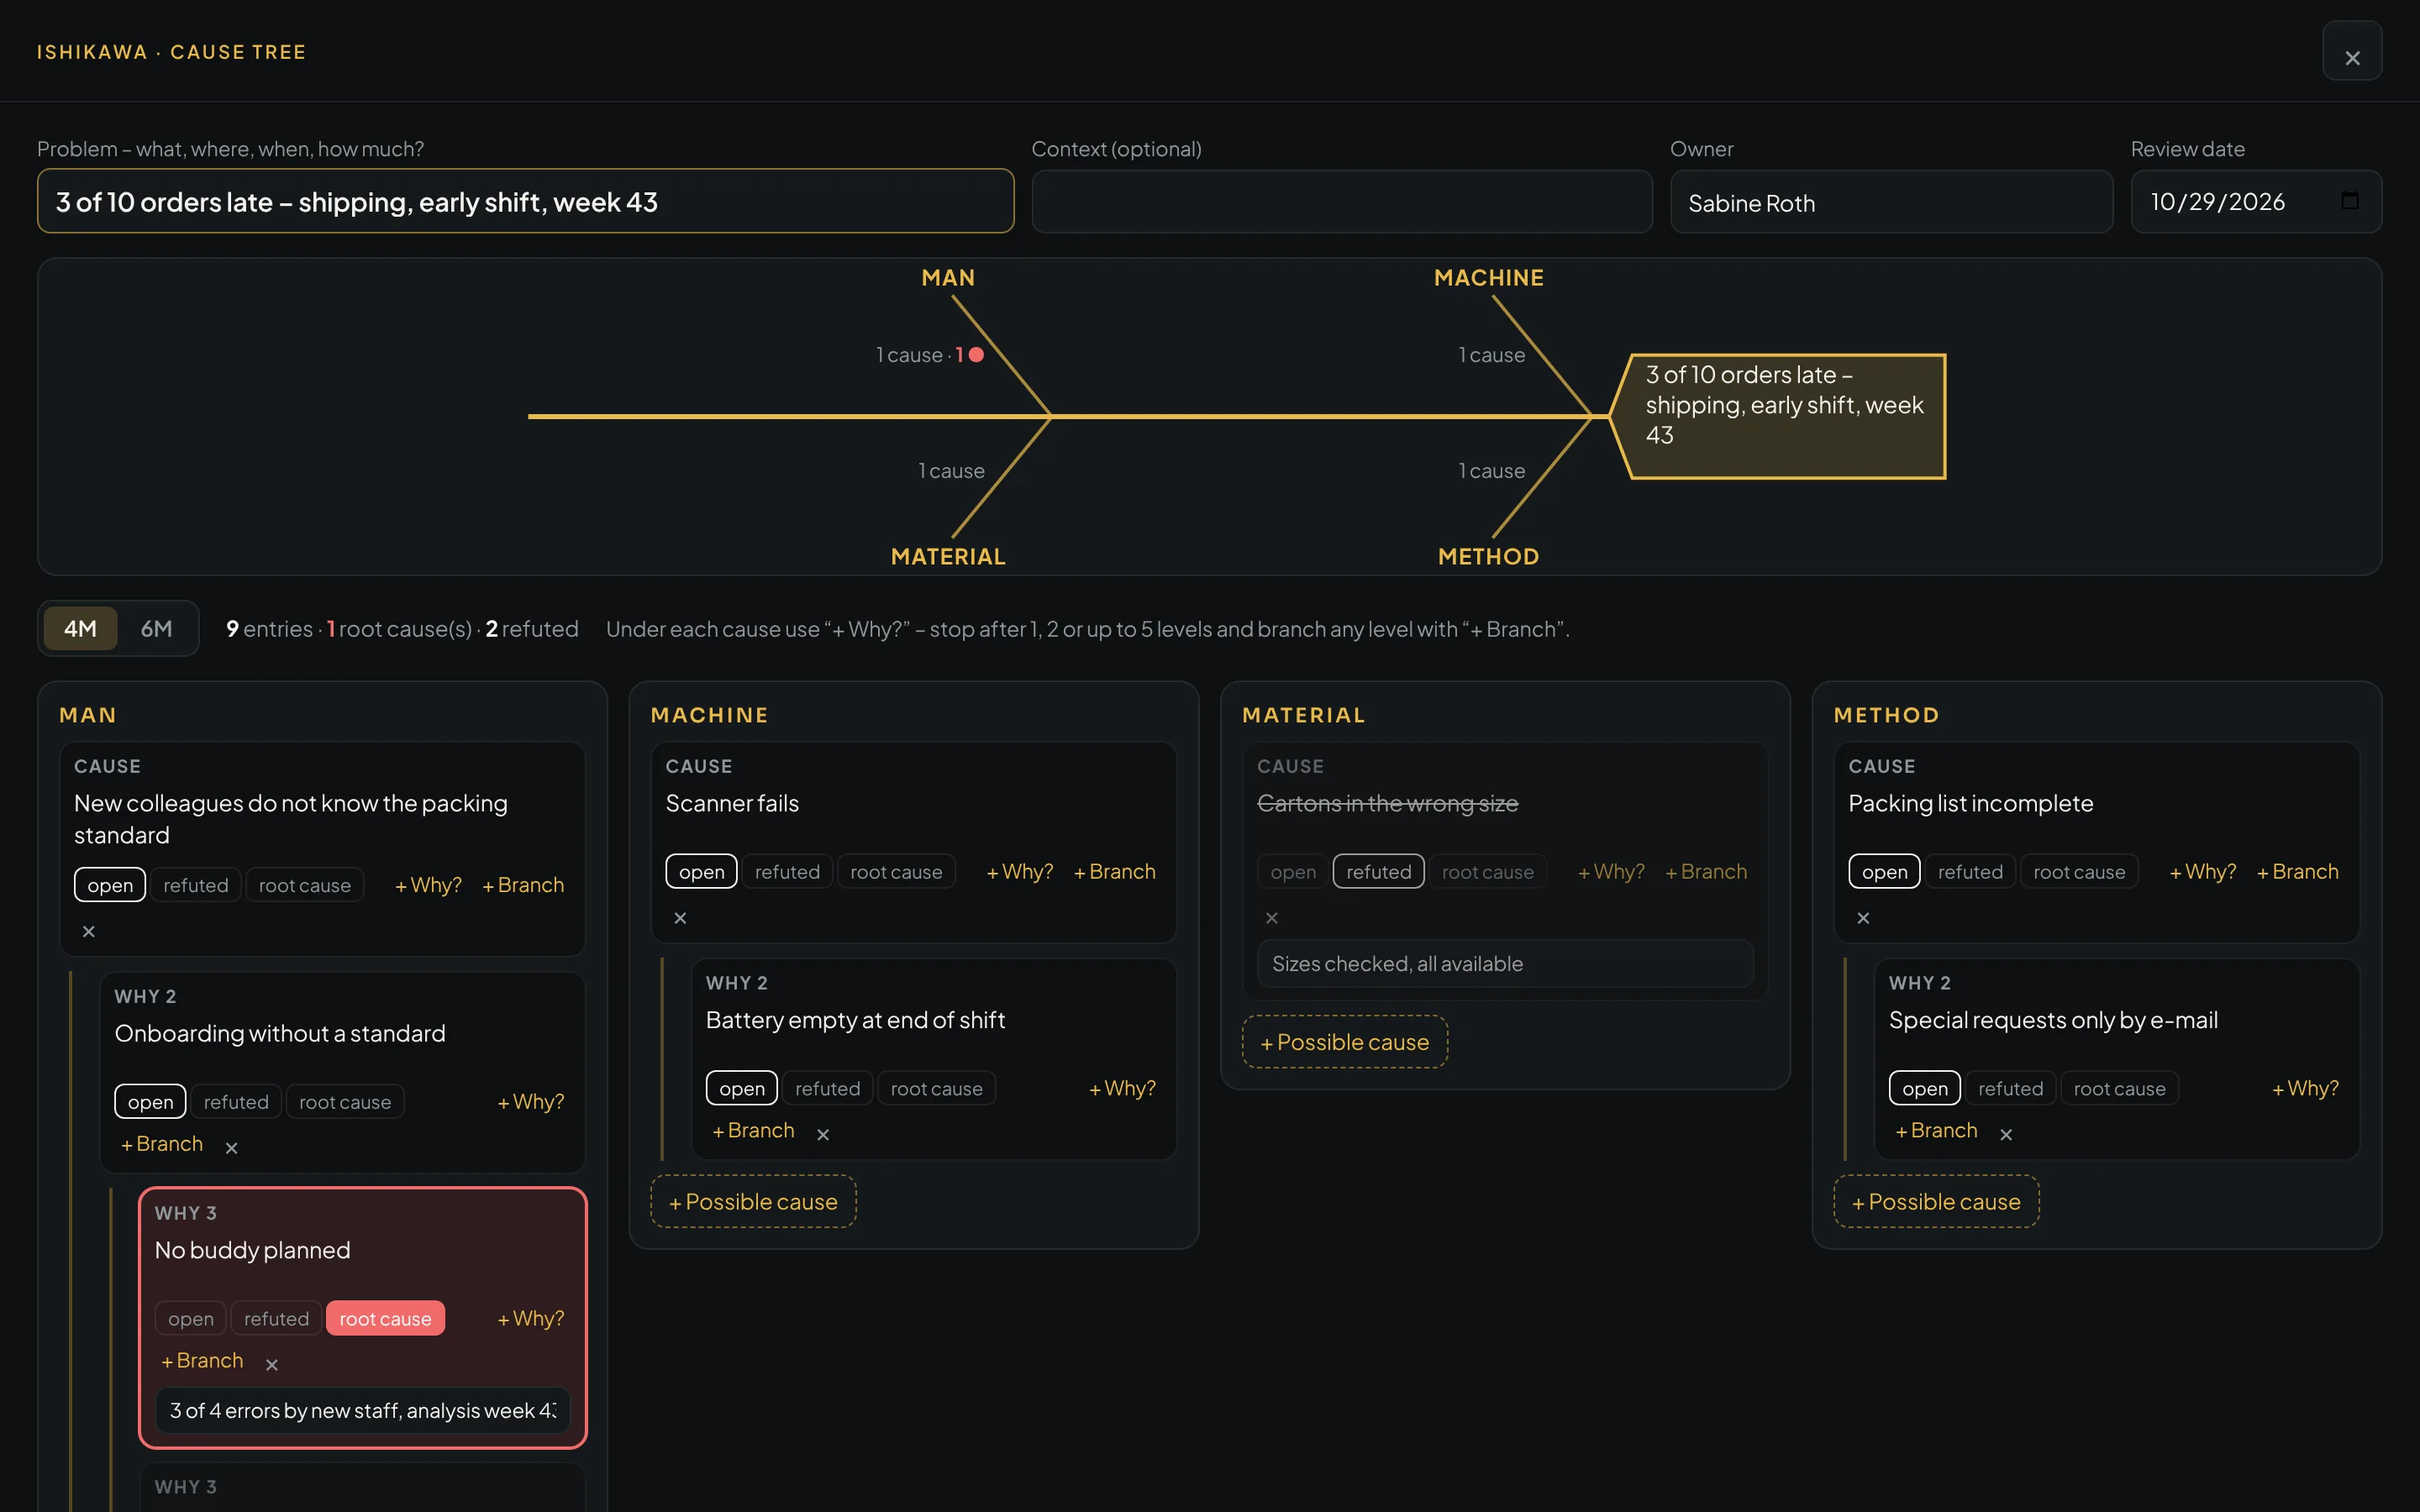
Ishikawa & 5 Why
From problem to root cause – with evidence.
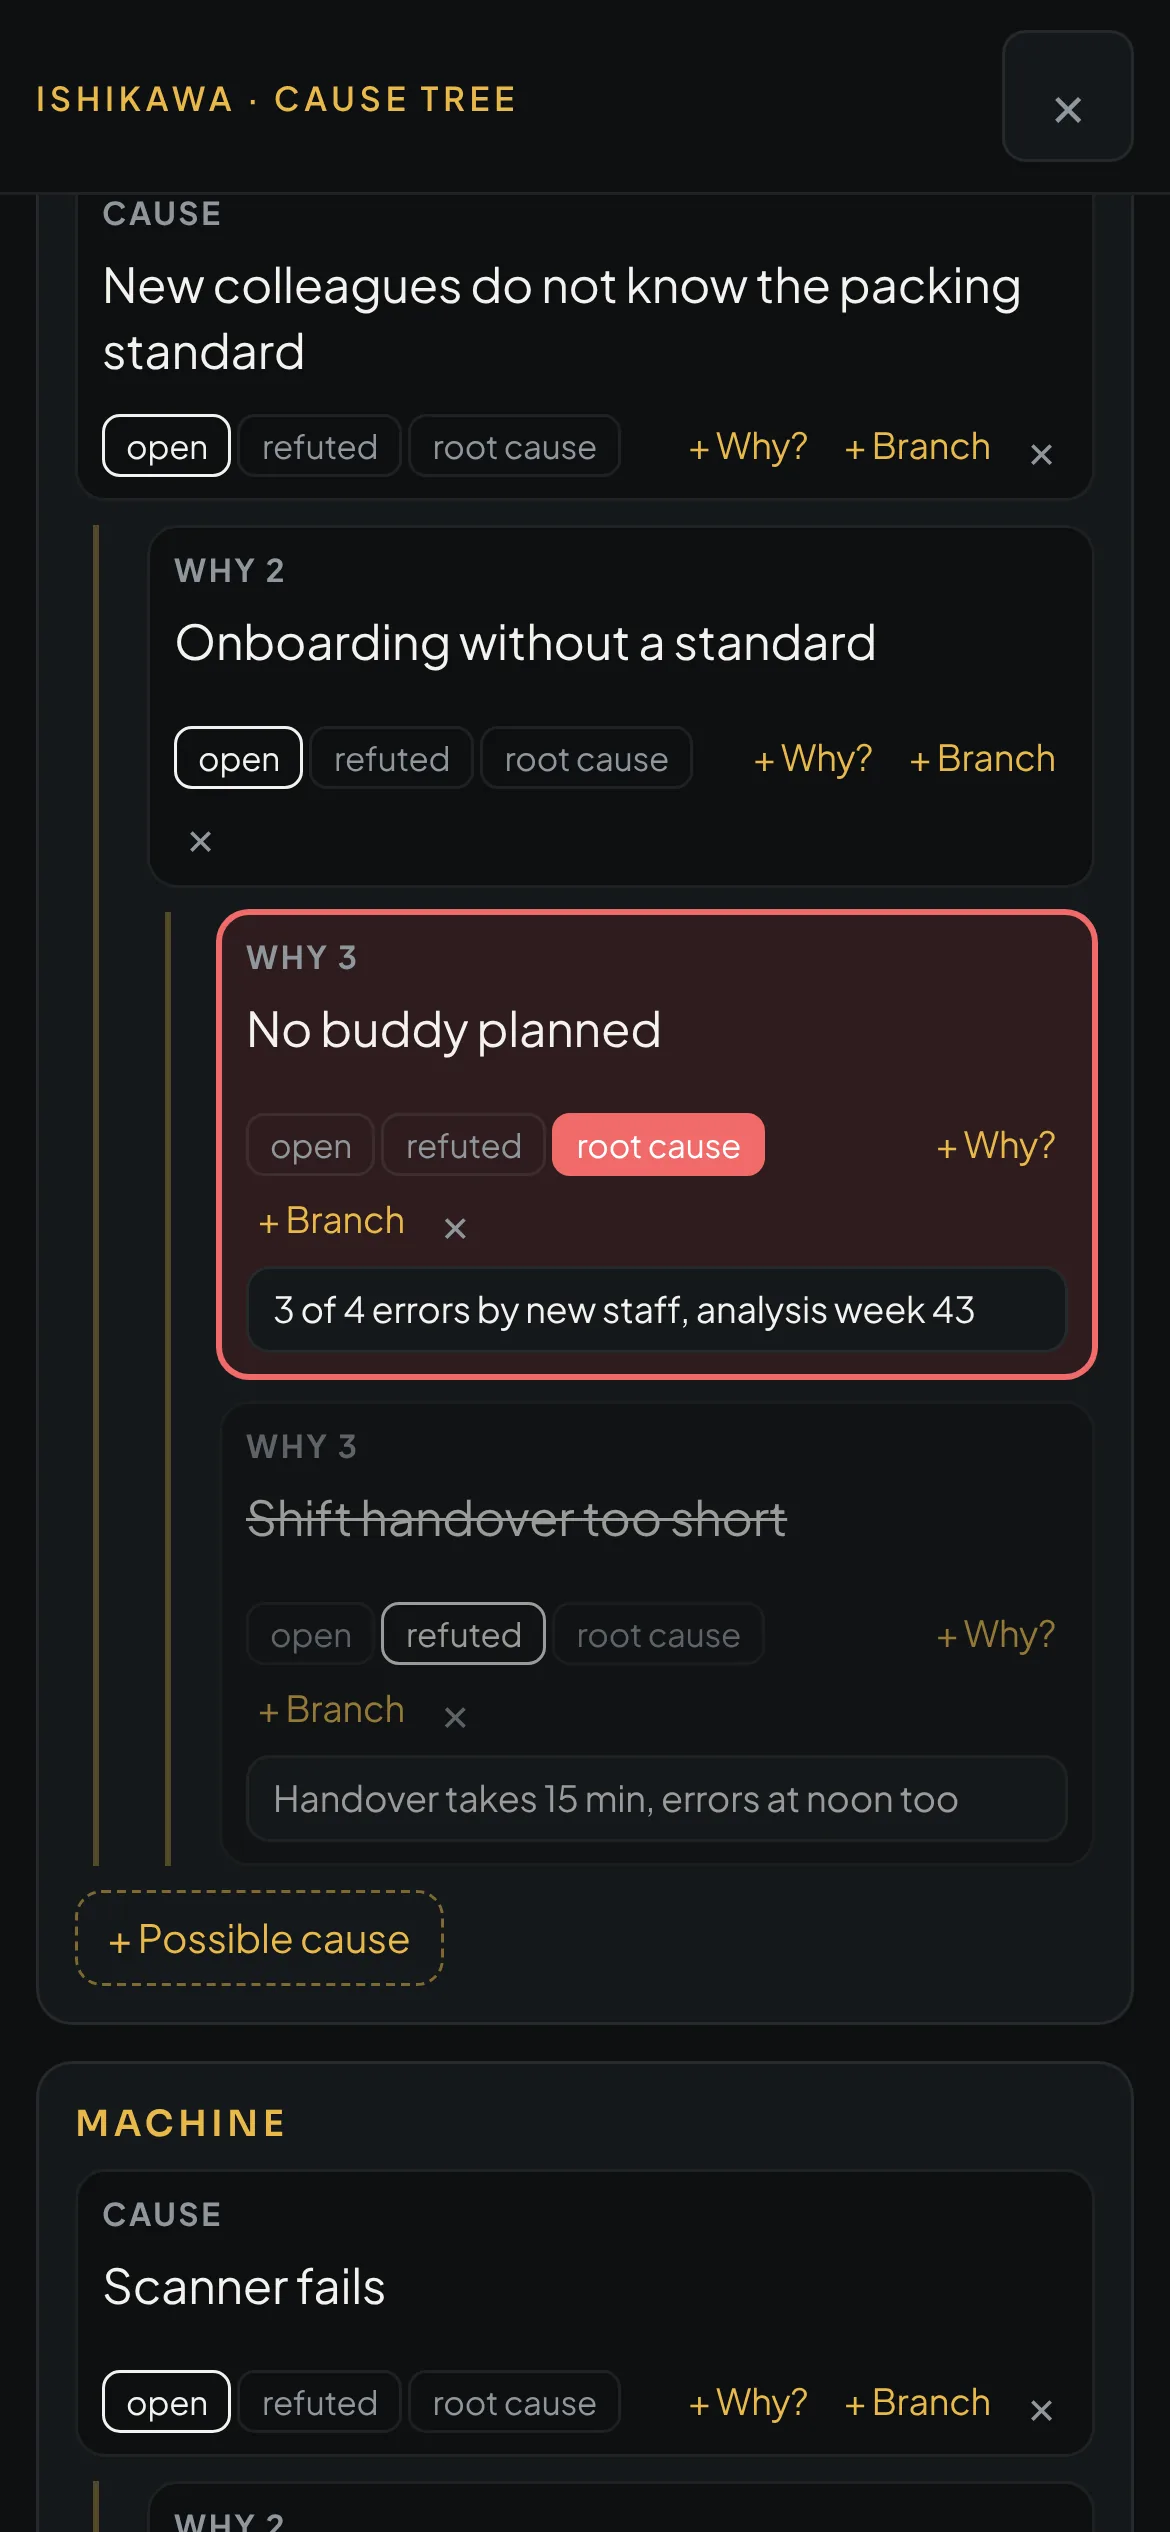
The problem sits at the head, below it 4M or 6M. Under every possible cause the why chain begins – as deep as needed, branched where there are several answers.
- Why 1 to 5 – stop early or branch at any level
- Refuted causes struck through, proven root causes red – with evidence
- One countermeasure per root cause with owner and due date
- 5 Why as a branching why chain – without categories, box by box
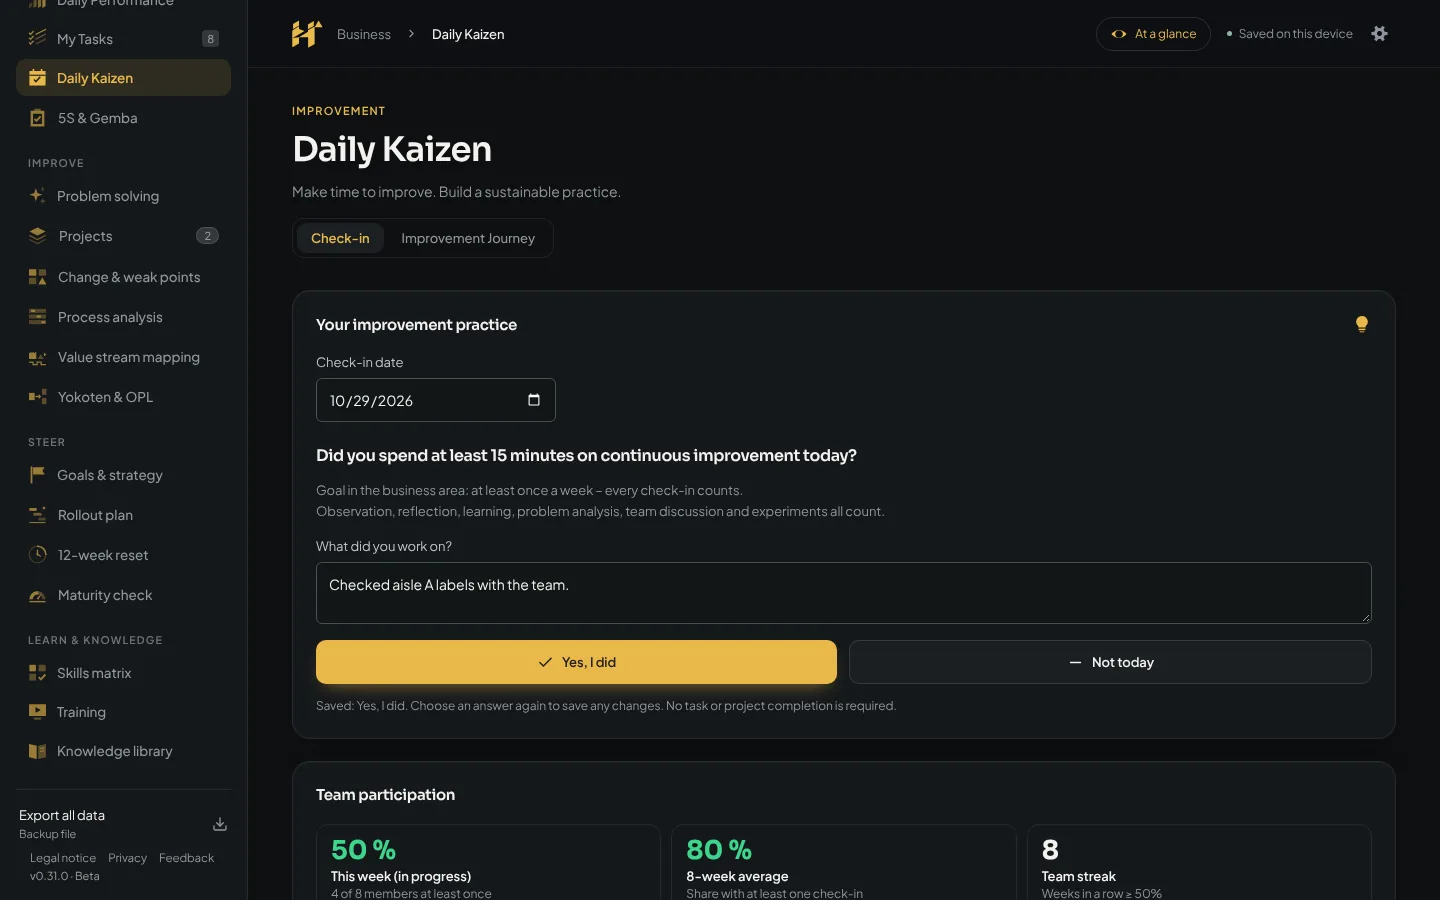
Team participation
How many in the team improve every week?
The goal is realistic: everyone takes at least 15 minutes for improvement once a week. A short check-in is enough – from this, H·DELTA shows how alive the improvement culture in the team really is.
- Participation this week, eight-week average and team streak in weeks
- Eight-week trend – each team sets its own target rate, e.g. 50 or 80%
- Anonymous: only how many say “Yes” is counted – never who
- Visible only from five team members, with no time tracking
More modules
What else is included.
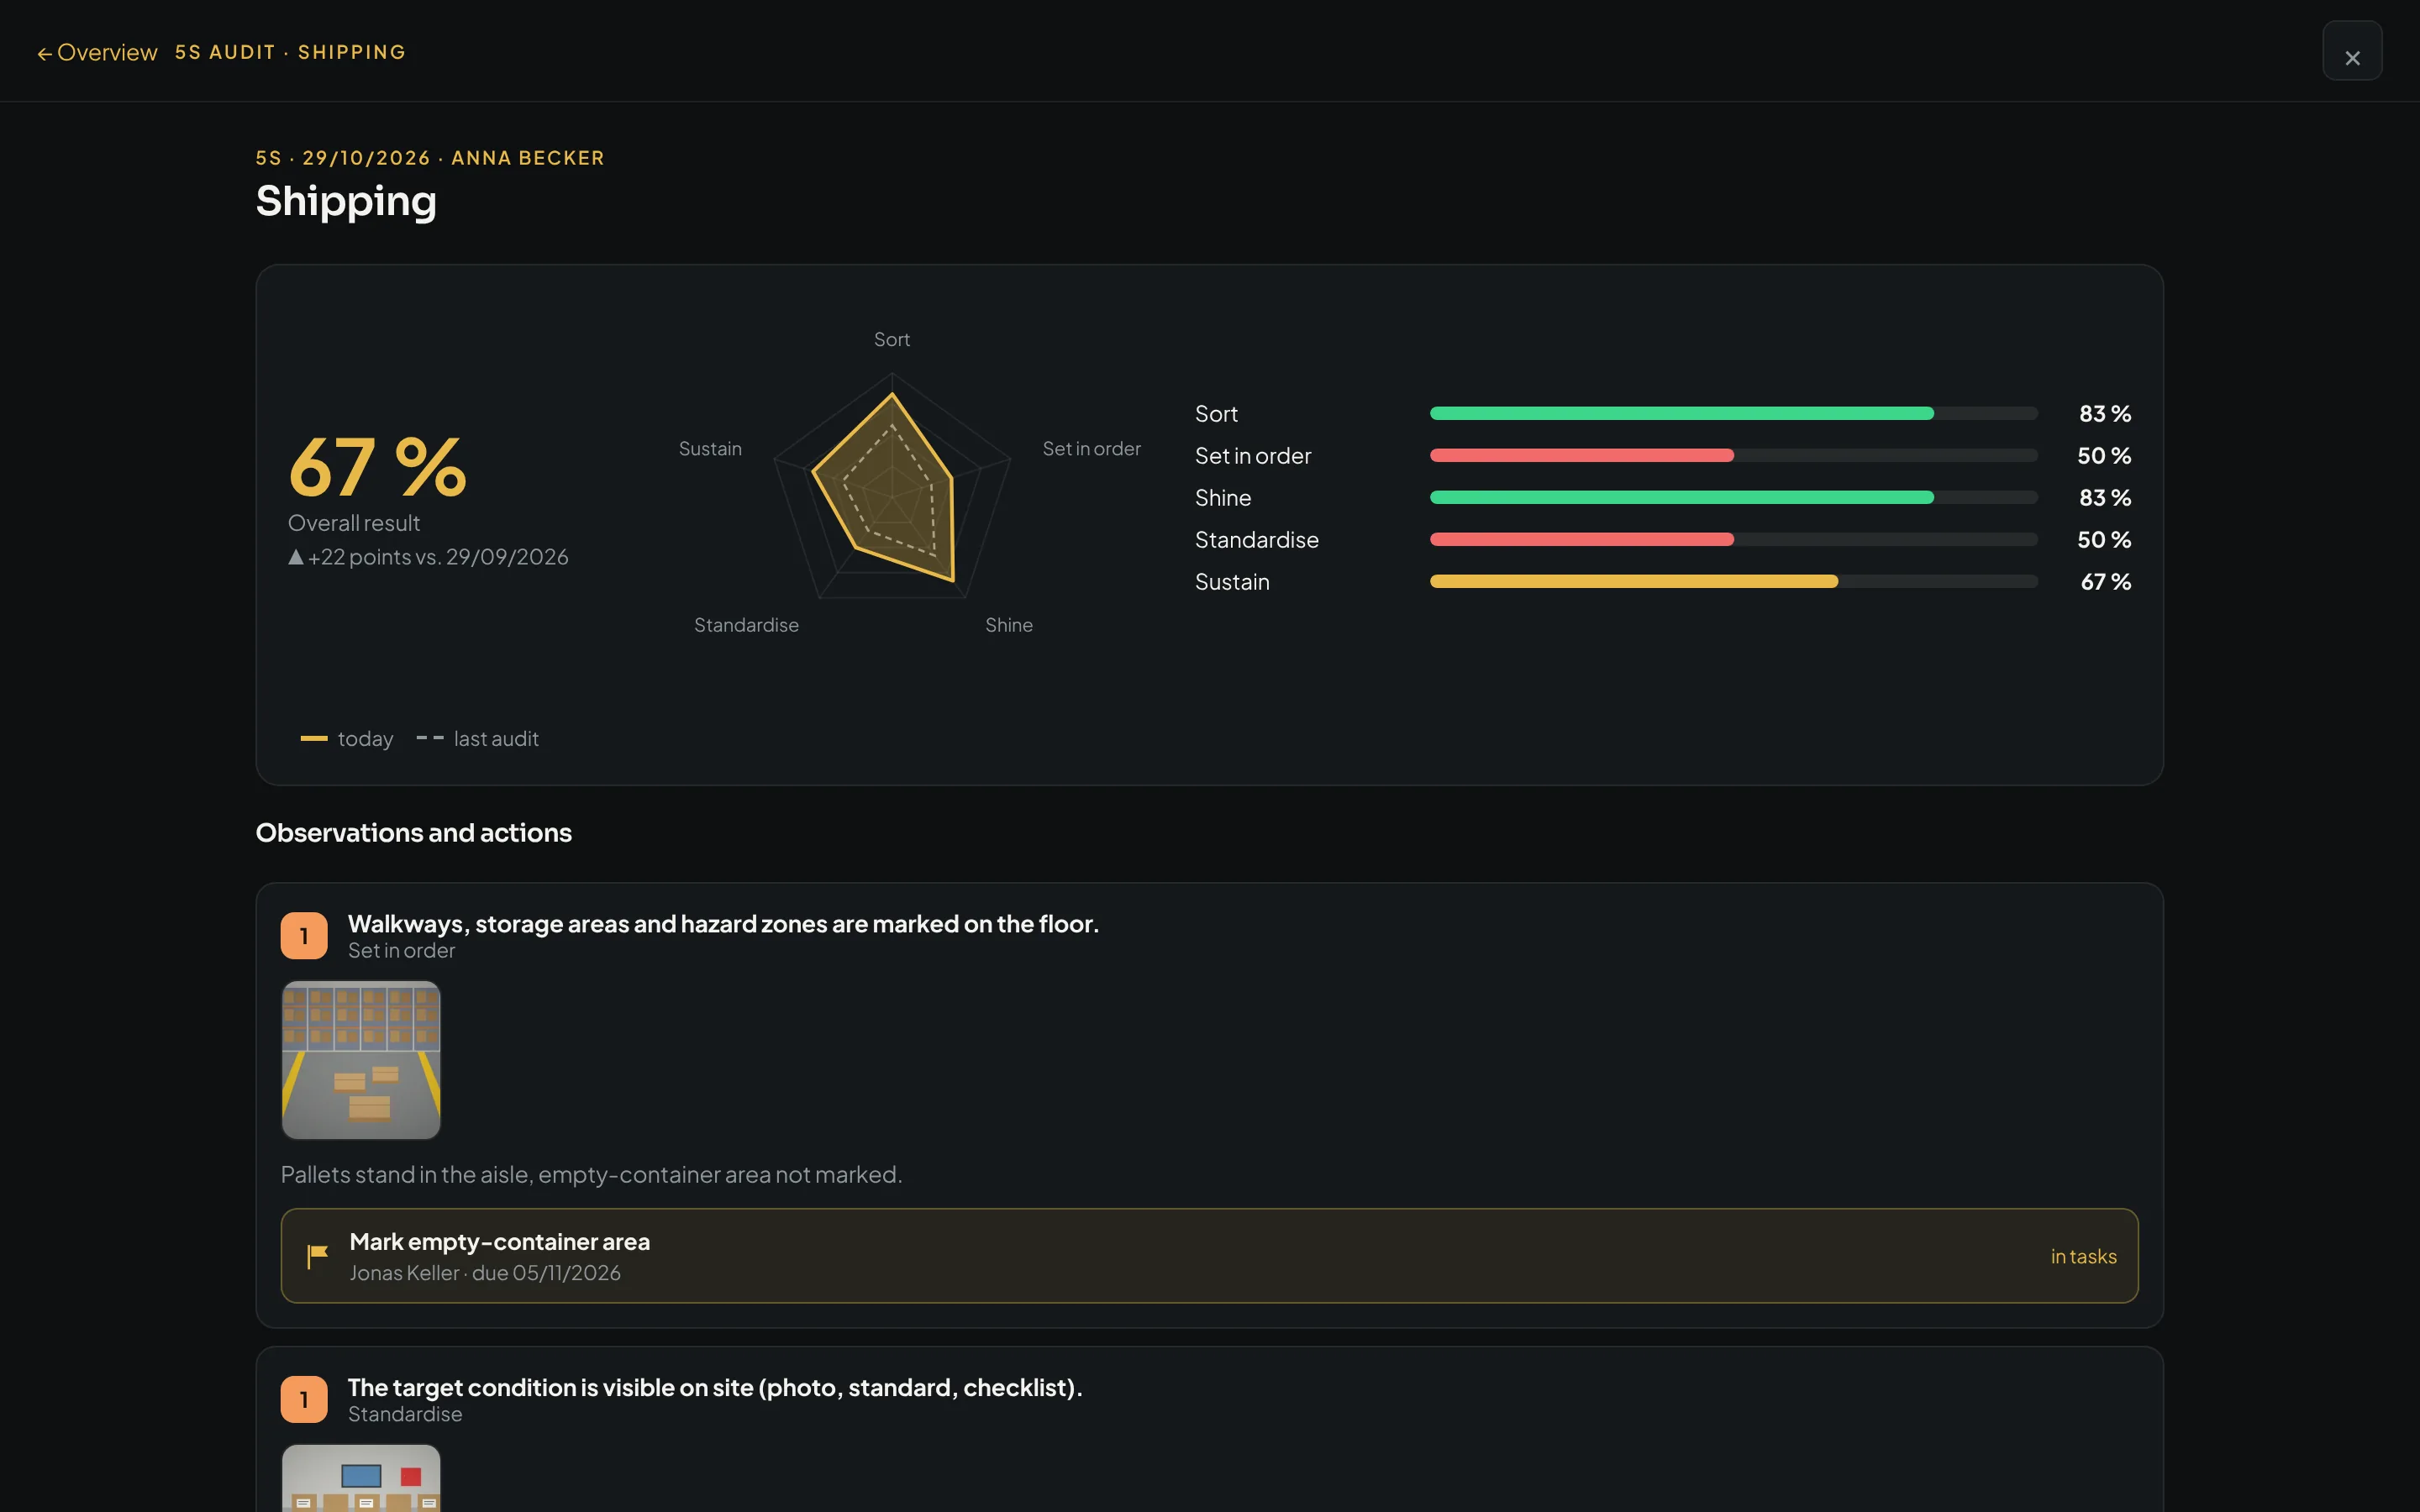
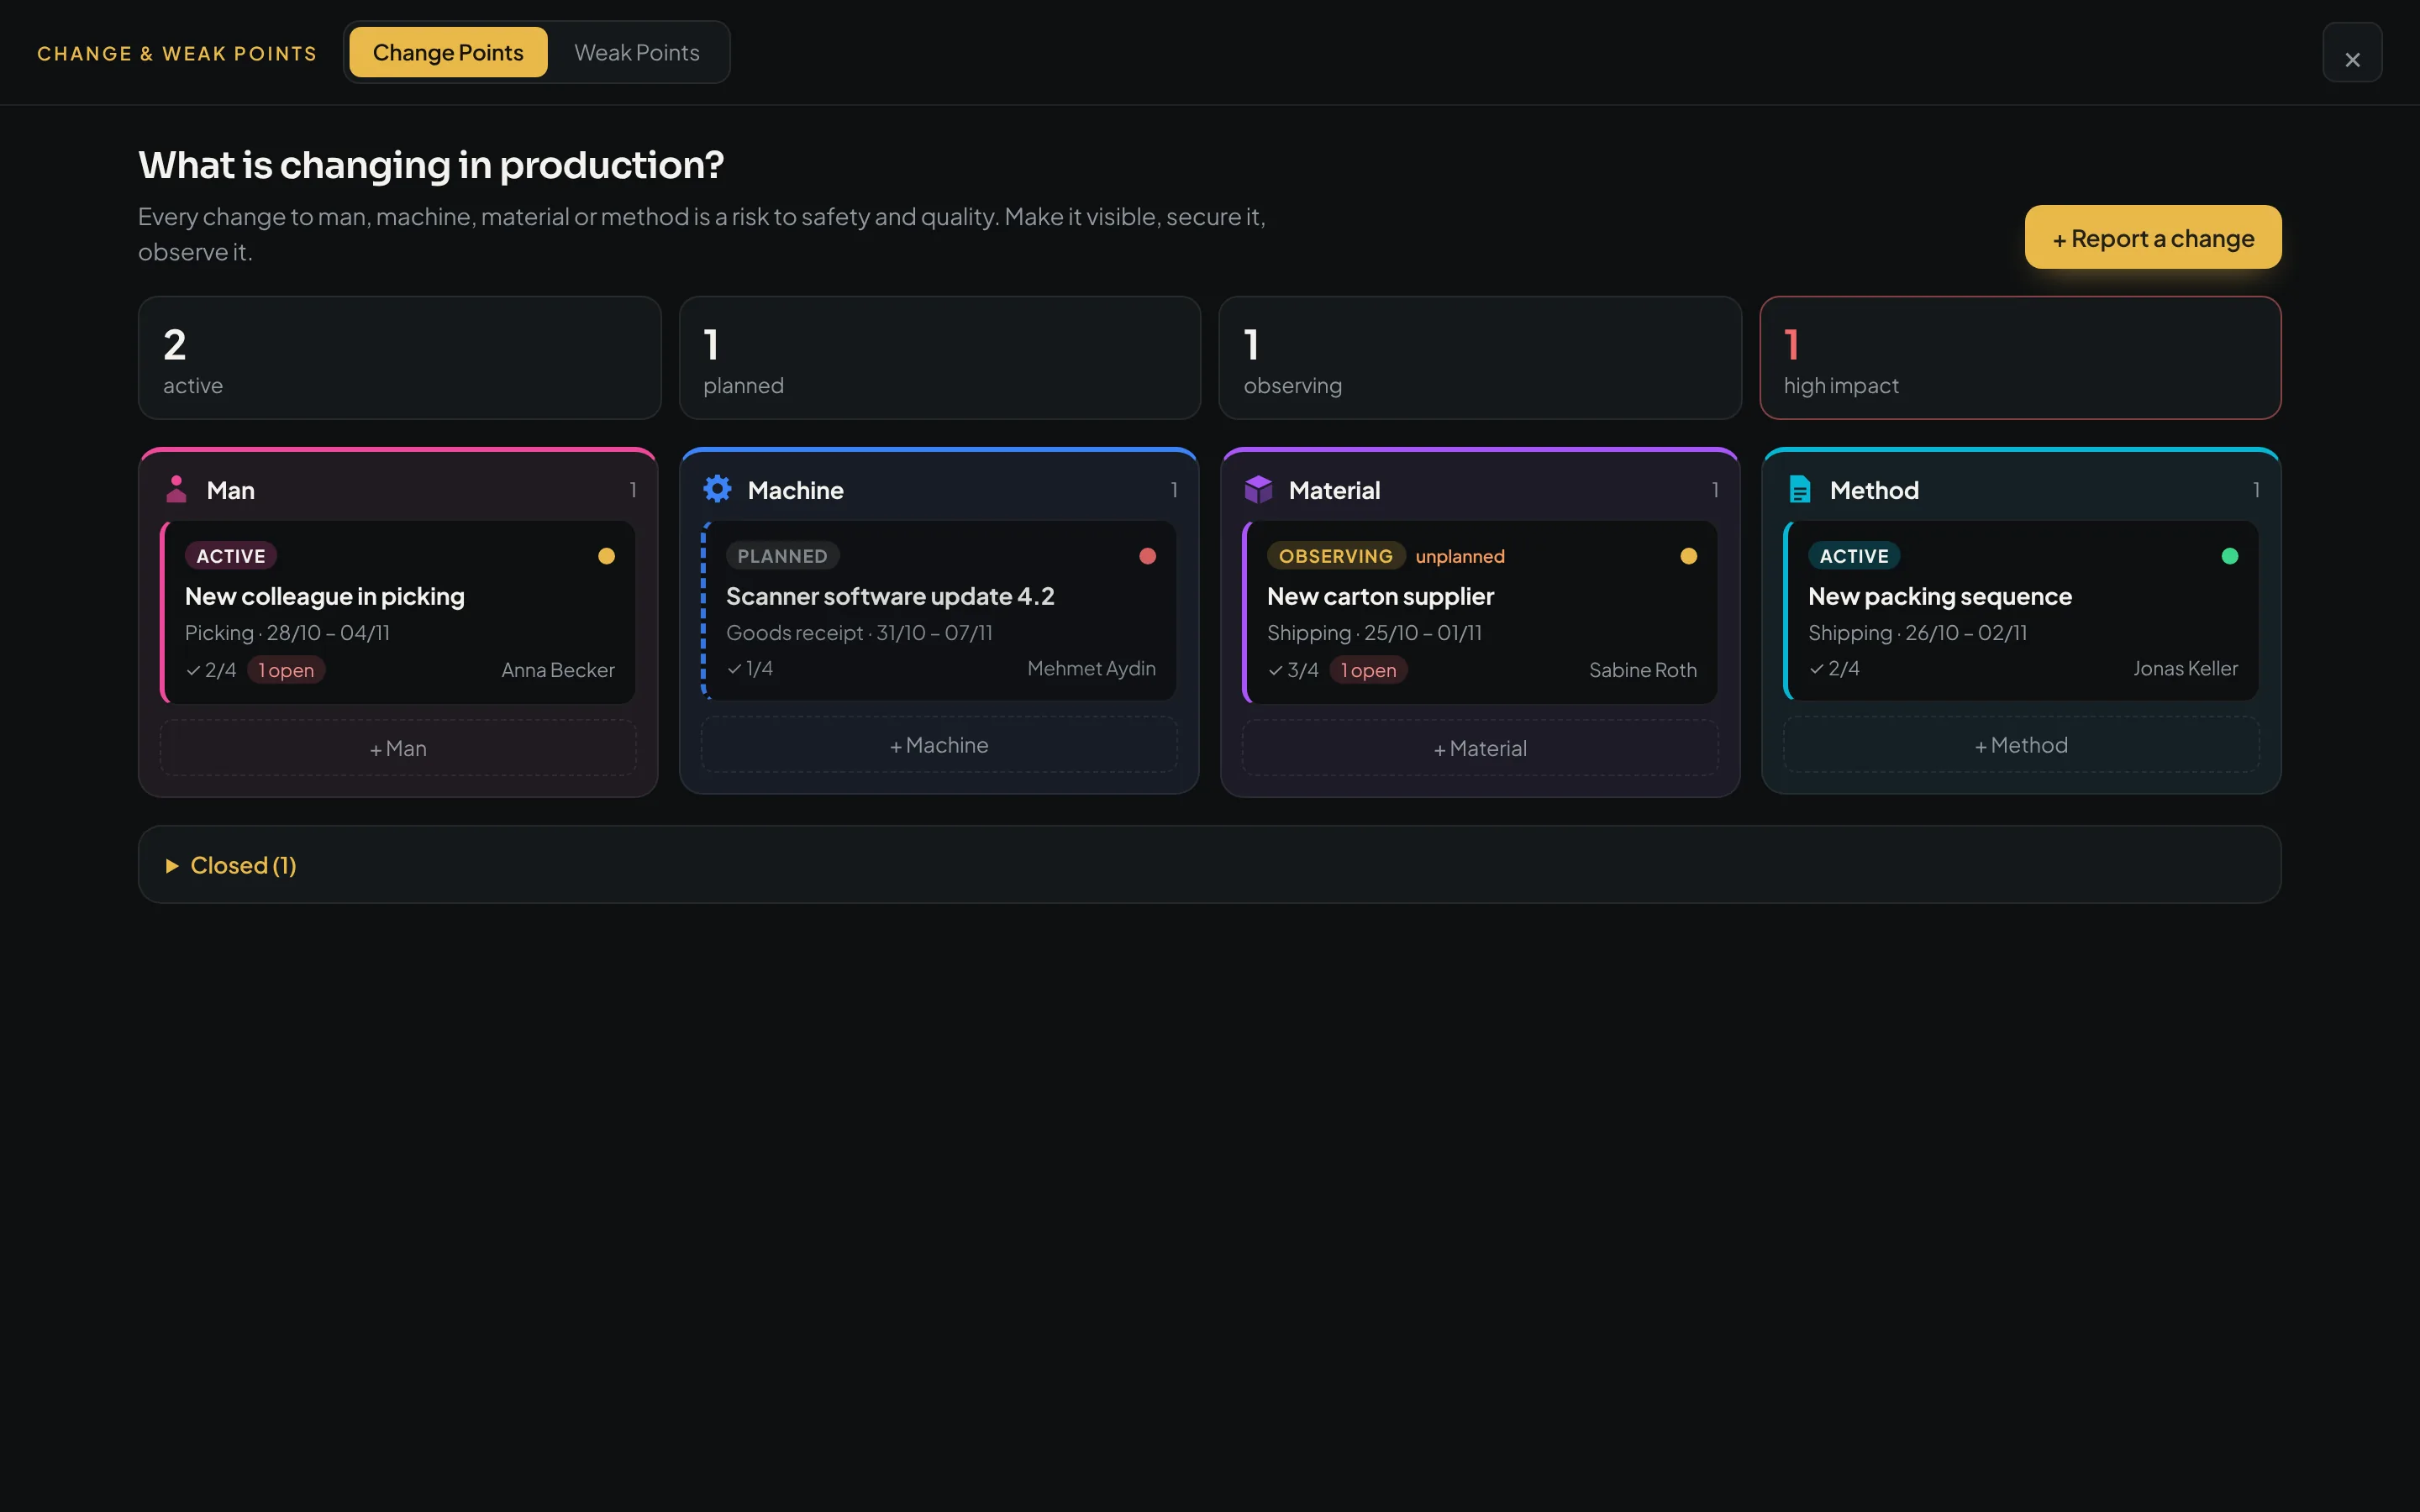
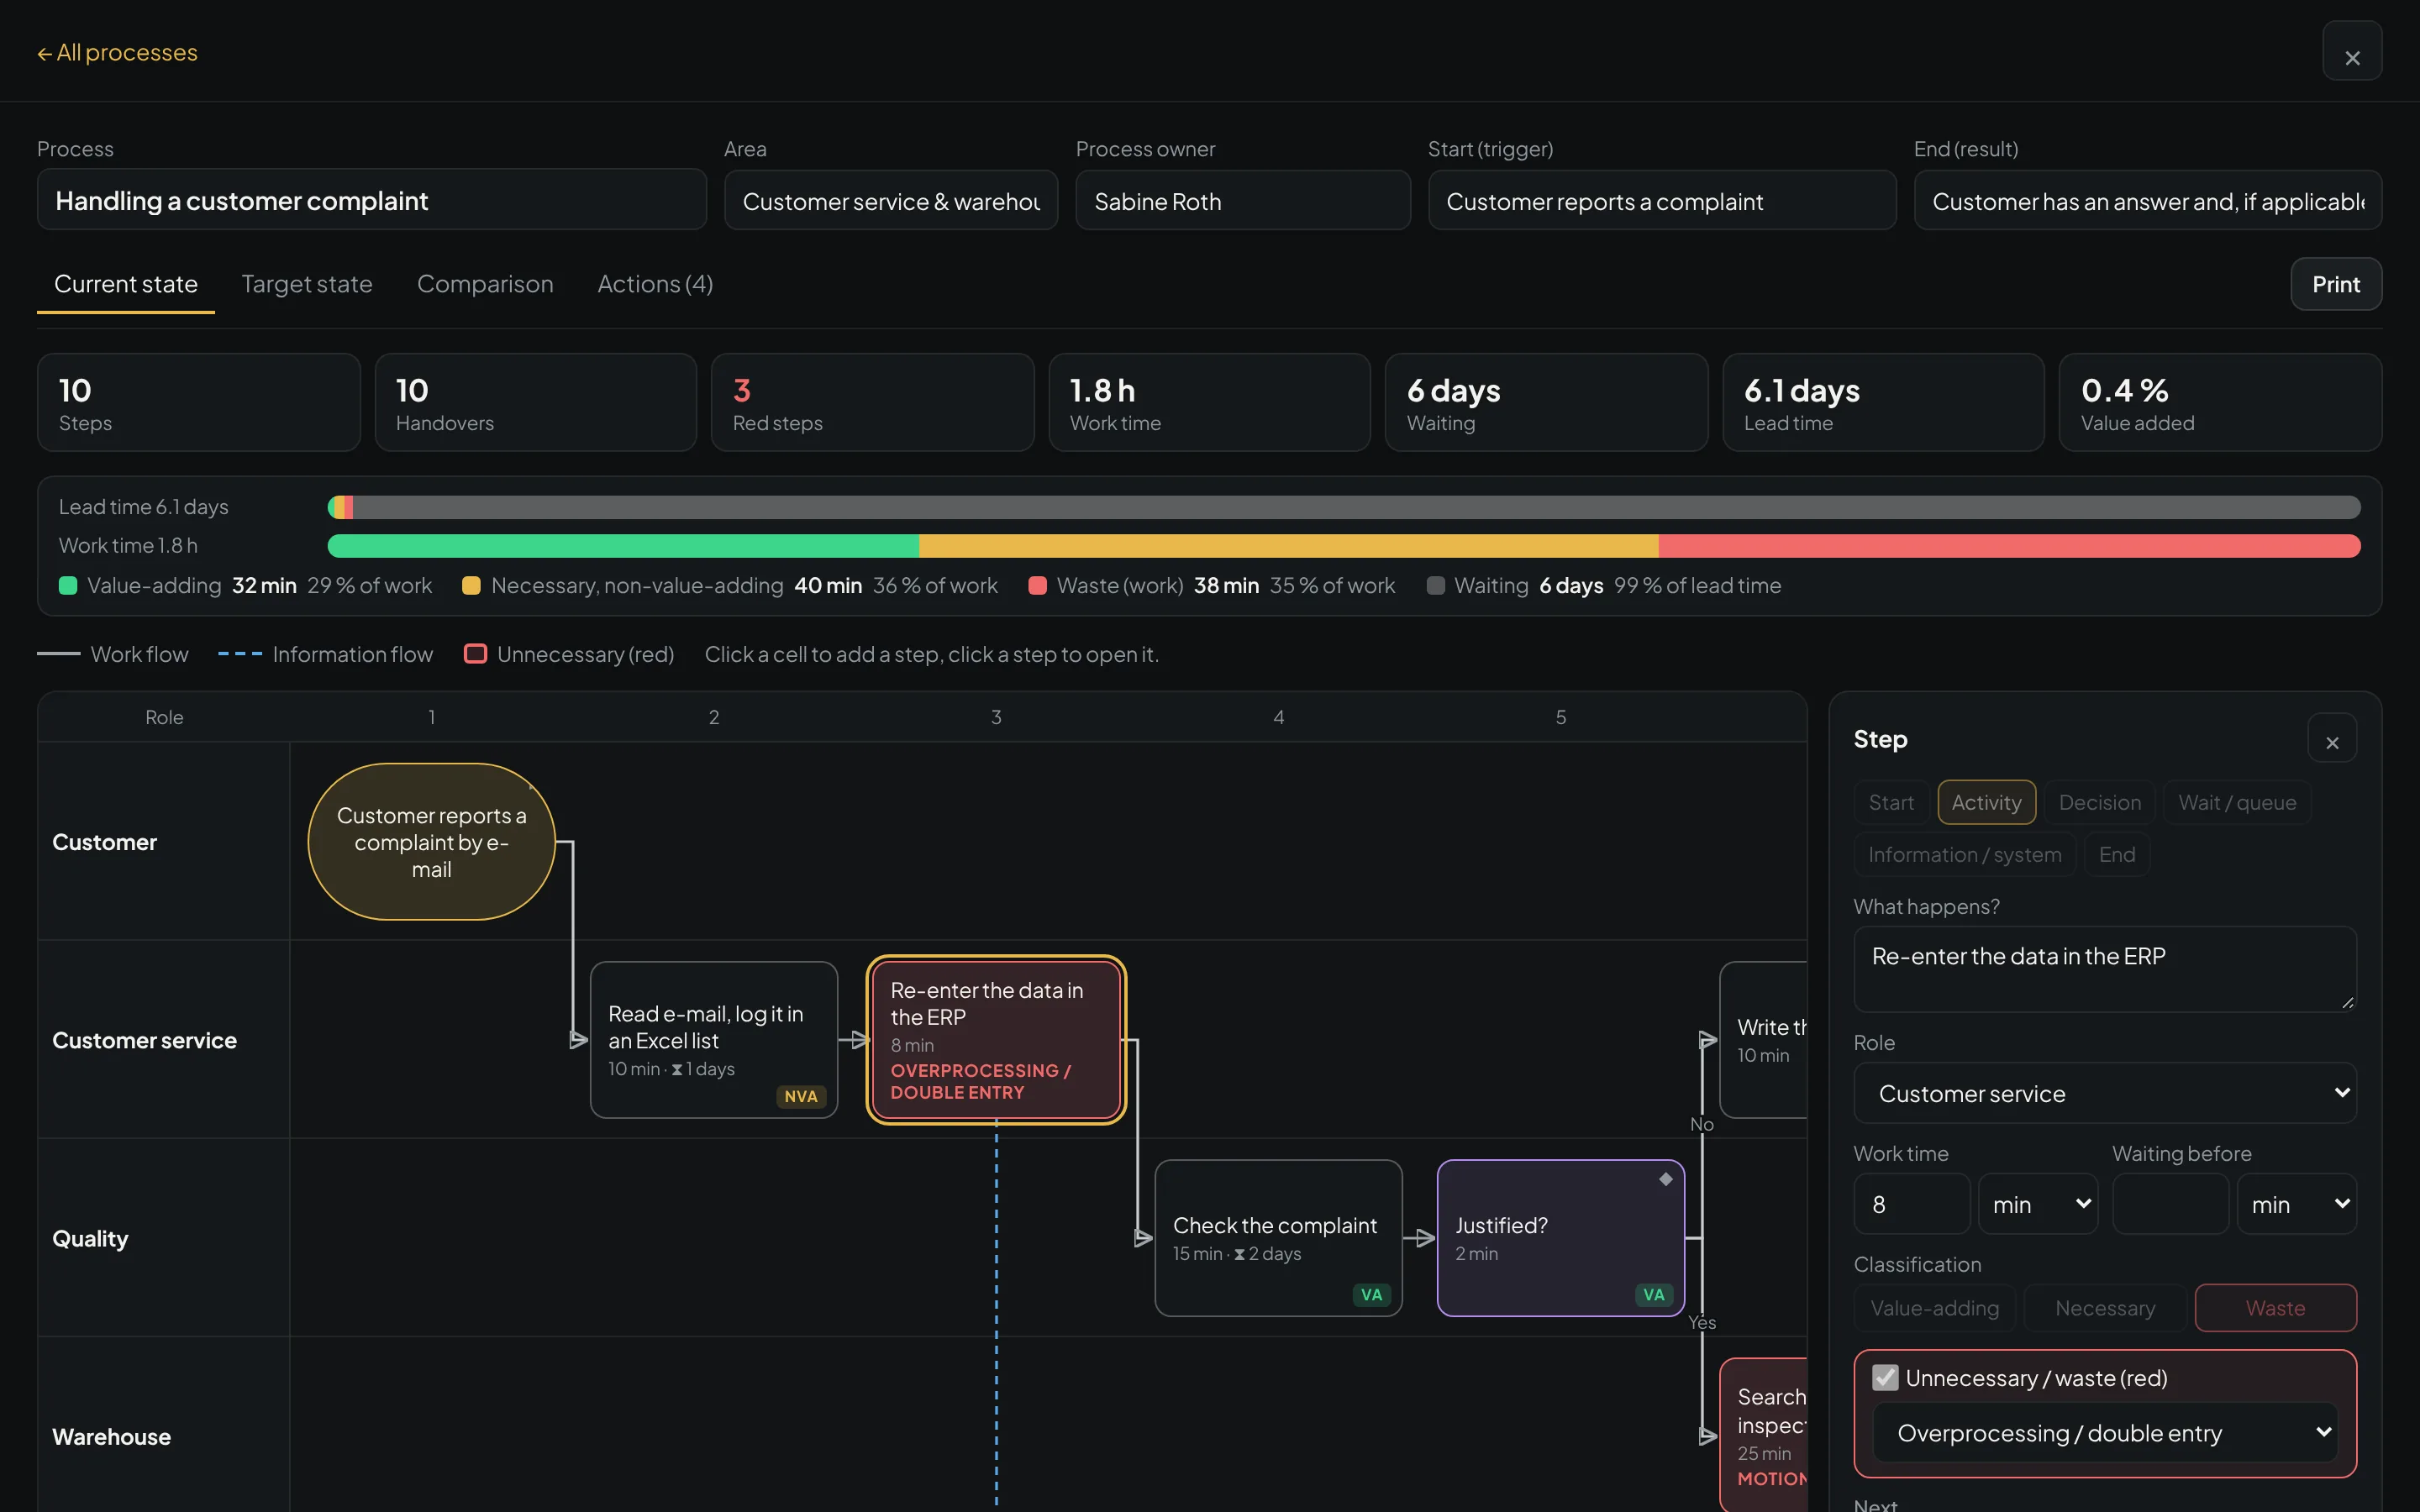
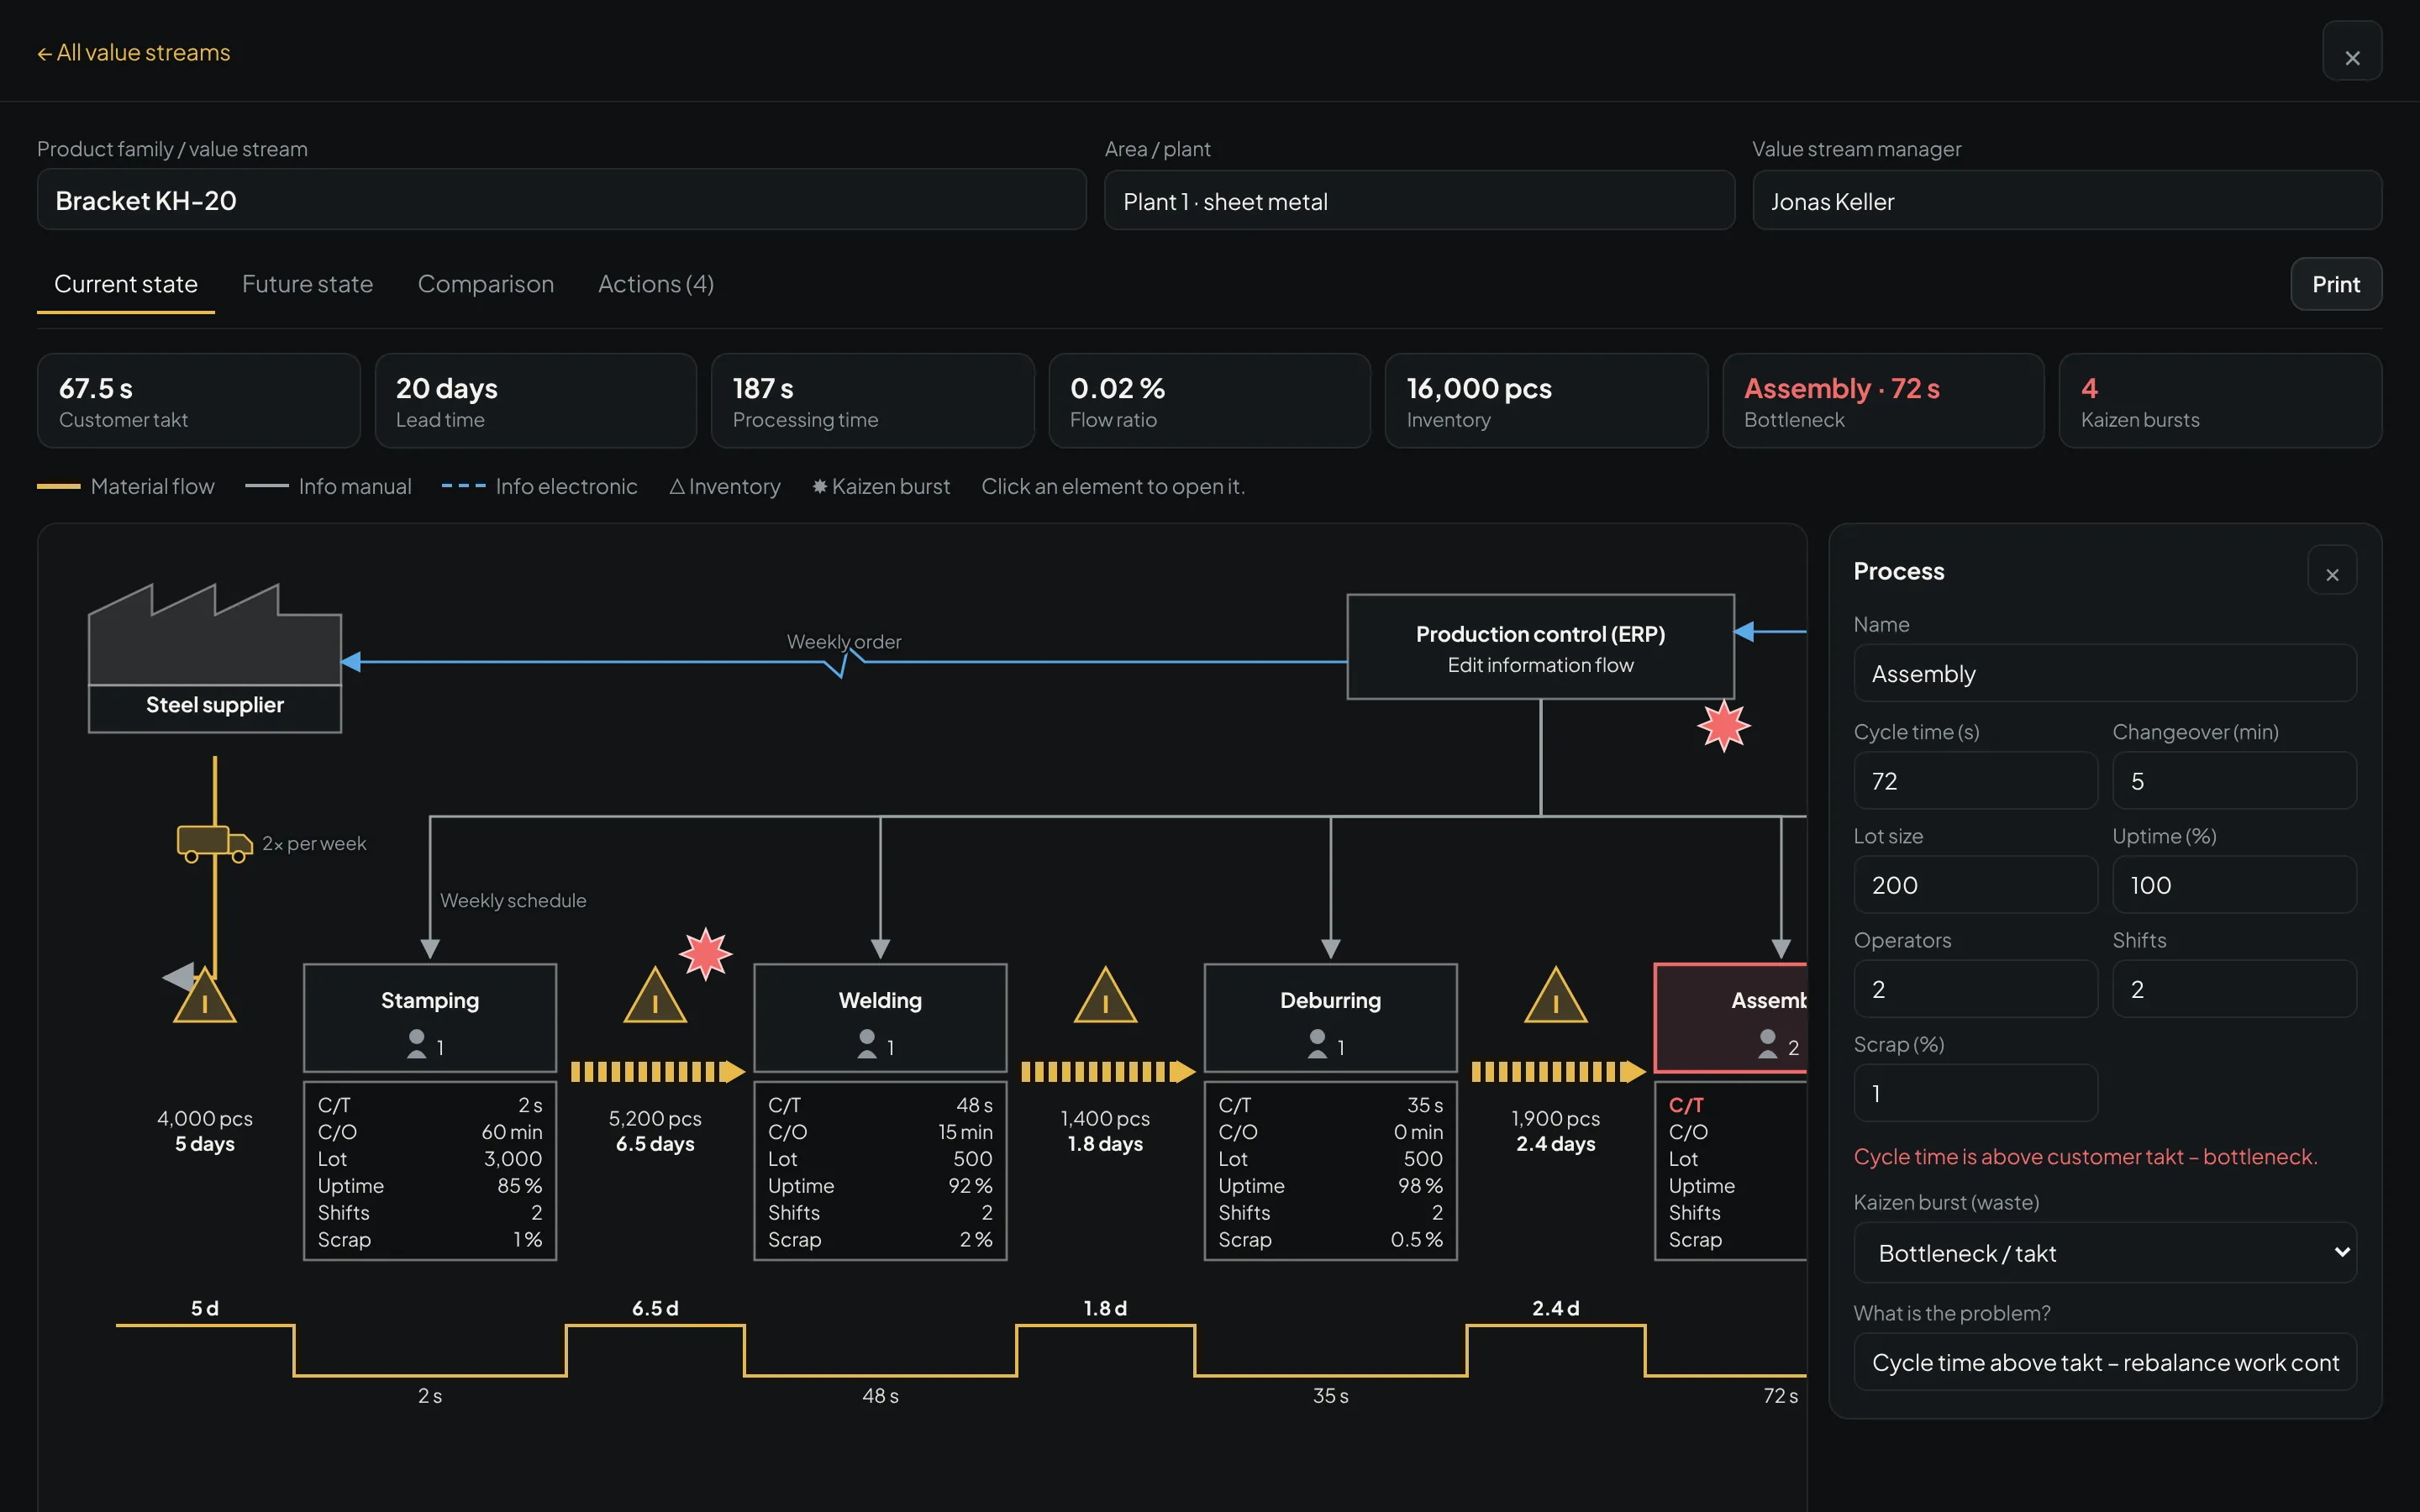
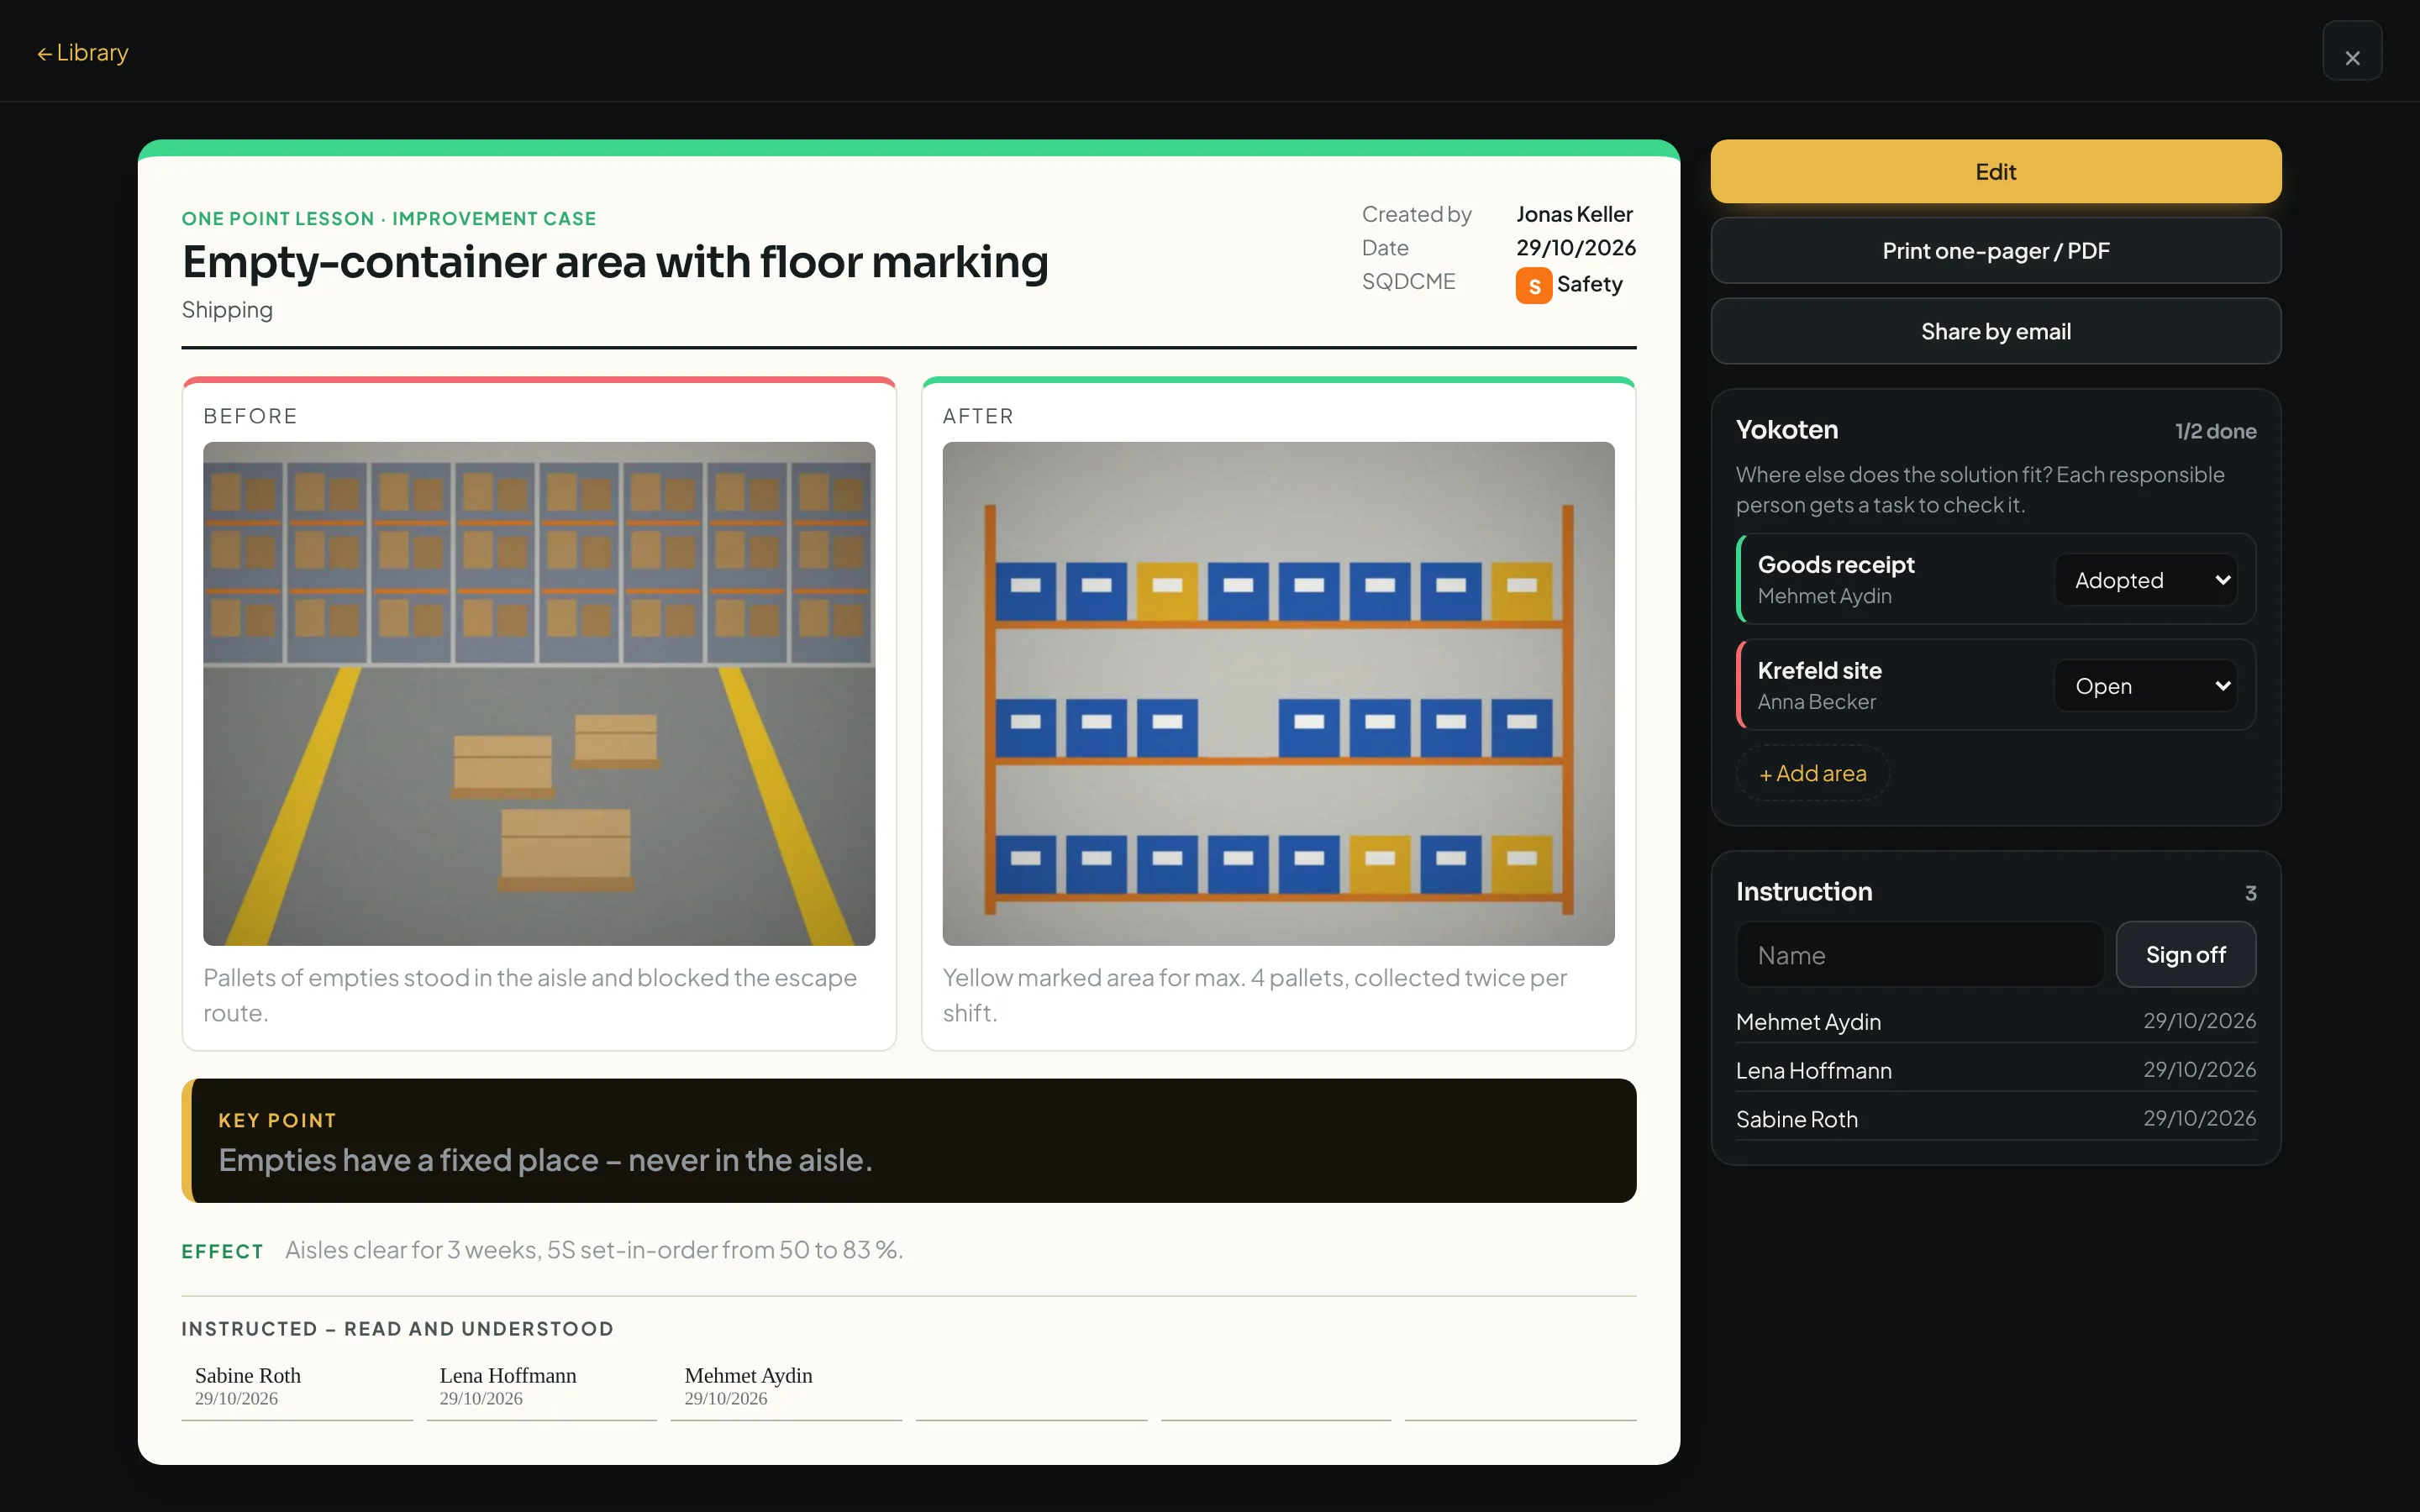
Everything that complements the core workflow – ready when your team is. No module is mandatory.
App or Excel
Two ways, the same tools.
HIGHDEL offers both – whichever fits your team and your IT.
H·DELTA
The app
Strategy, goals, KPIs, tasks and problem solving in one place – in the browser, on PC and on your phone.
Excel templates
The templates
The same tools as Excel templates – including the maturity check – for teams that prefer to work in their familiar environment or do not want to introduce a new app (yet).
Beta
Now in beta.
What you can test today, what is being built and what is planned – so you know what you can rely on.
For companies, teams and leaders.
Core: KPIs and problem solving
- KPIs by SQDCME with top 4, 30-day trend and team level (team → area → plant)
- Deviations in three steps: contain, find the cause, verify the effect – critical KPIs immediately
- Problem solving with 5 Why, Ishikawa and A3 – with evidence and root cause
- Actions with owners and dates; a case closes only with a verified effect
- Daily kaizen with visible team participation
- Strategy and goals down to the task in the team
For the 12-week reset
- Guided roadmap with weekly check and impact report as PDF
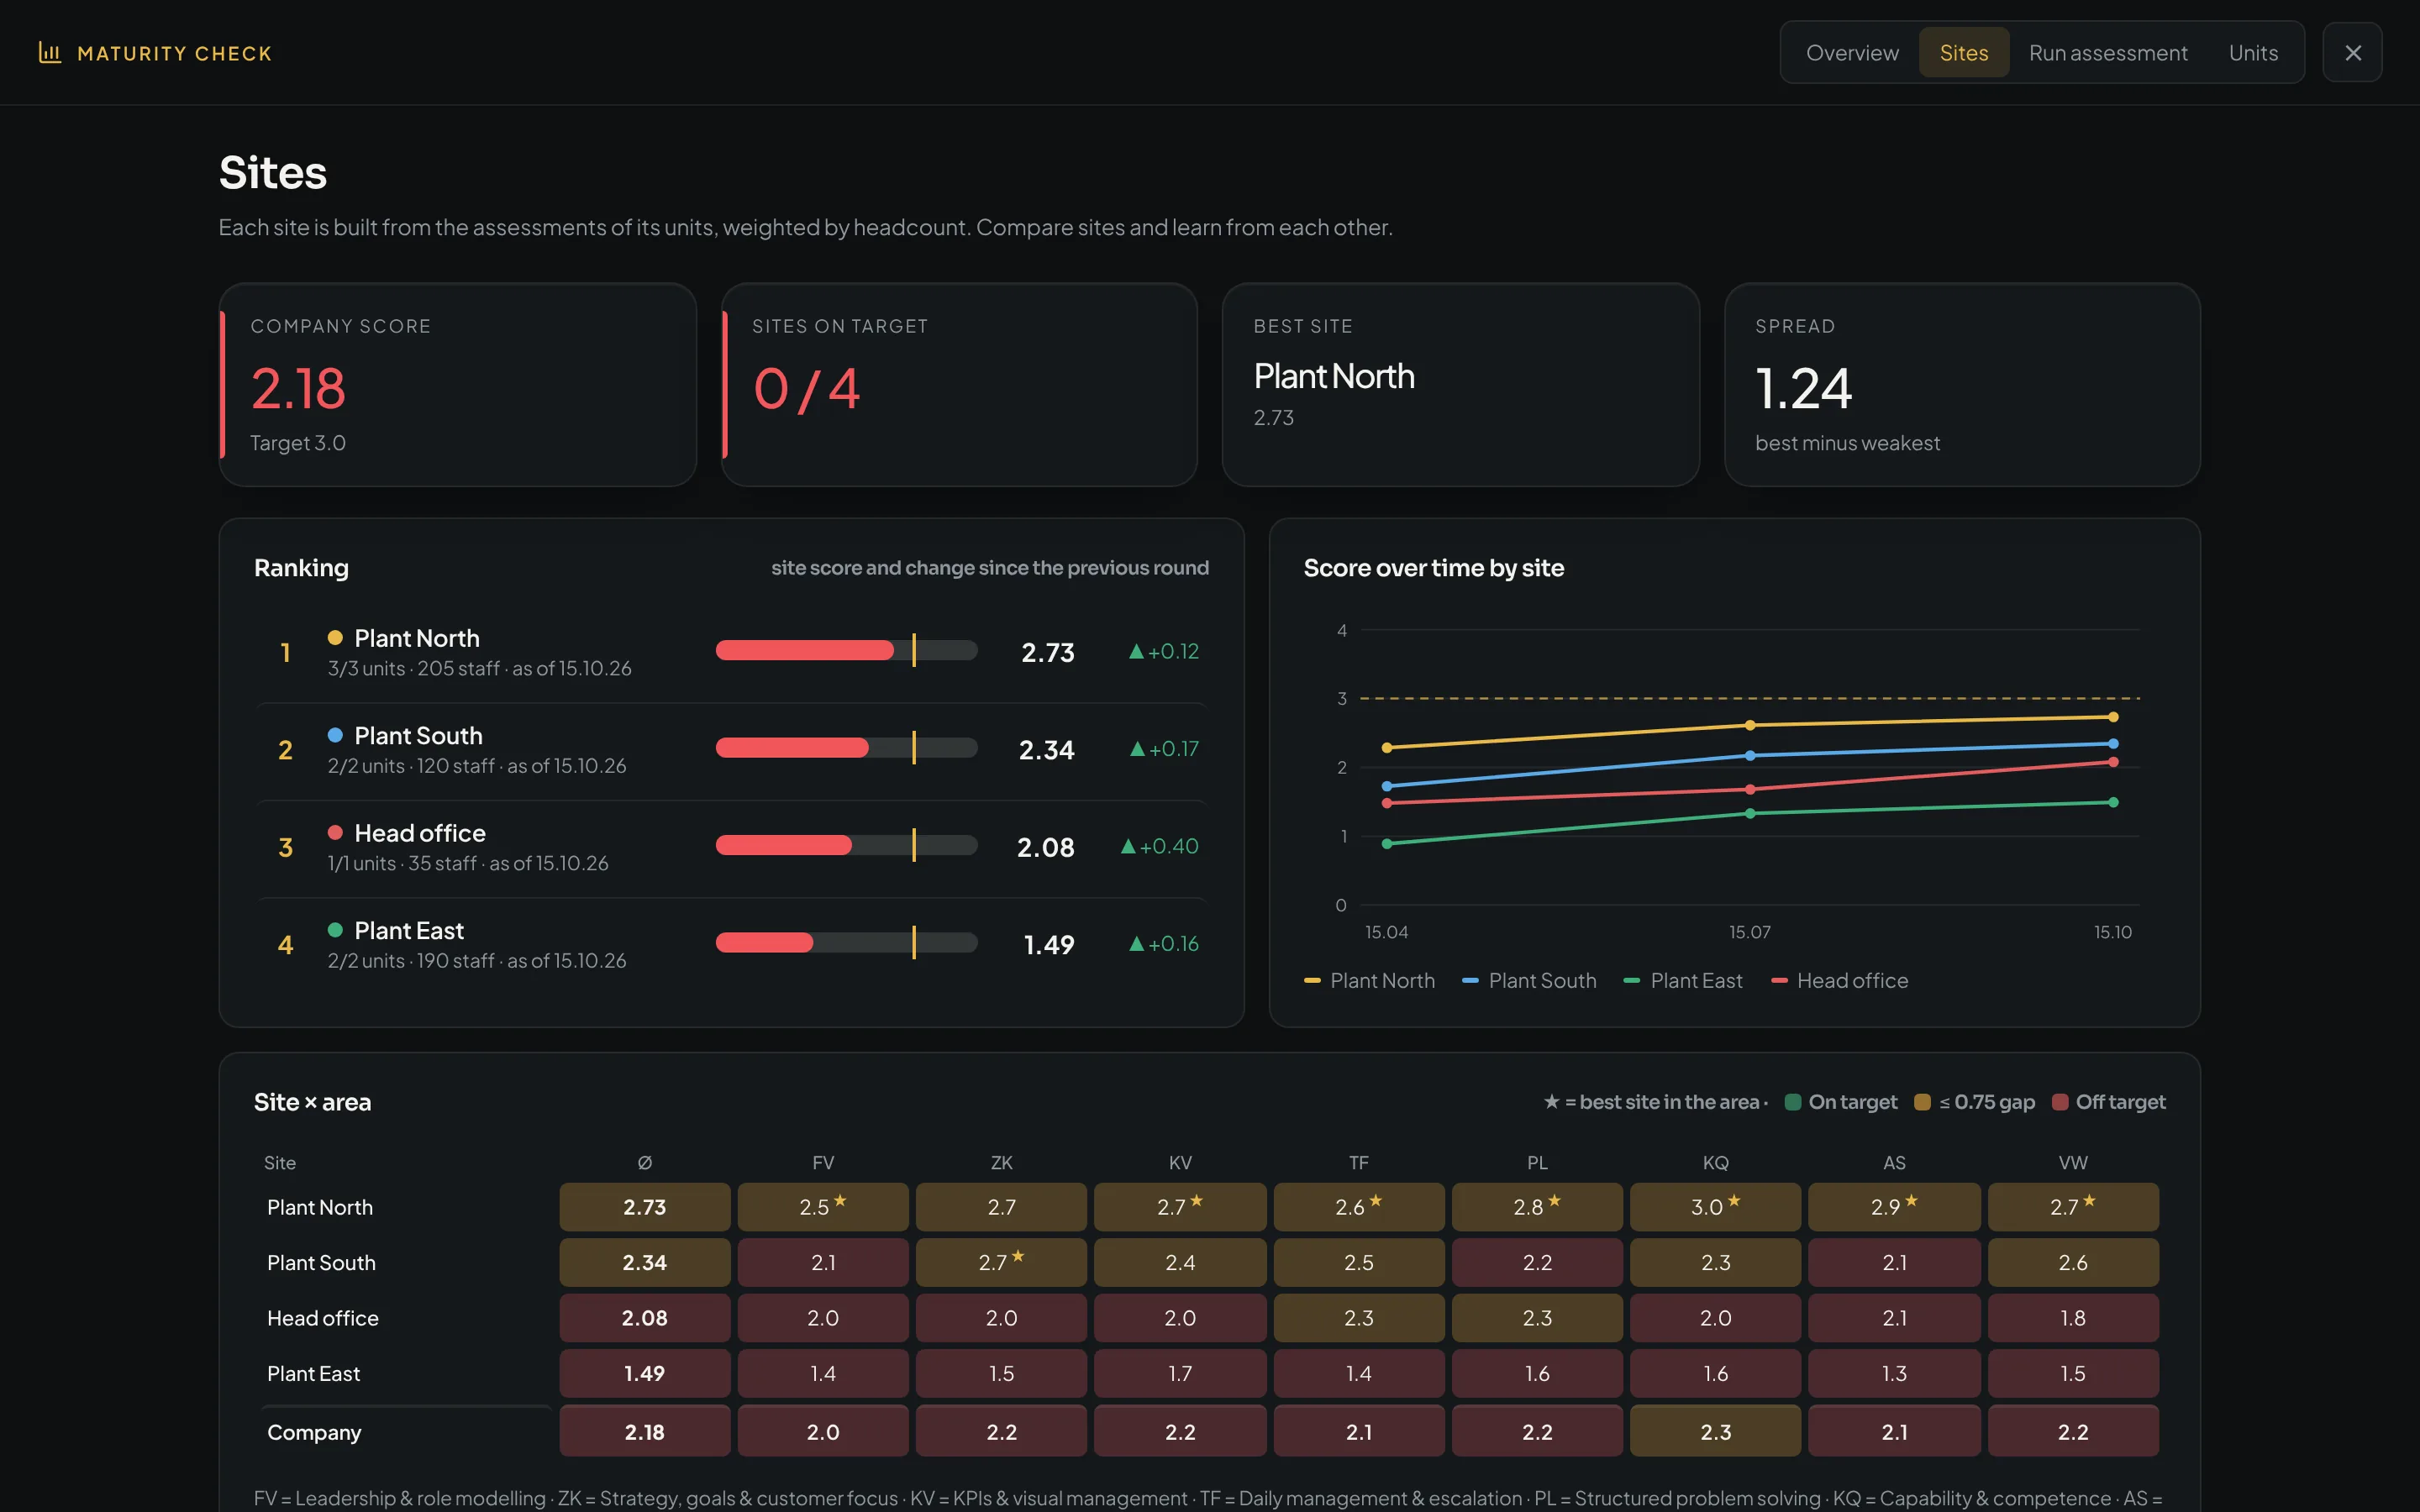
- Maturity check with 50 questions in eight areas – start and re-check
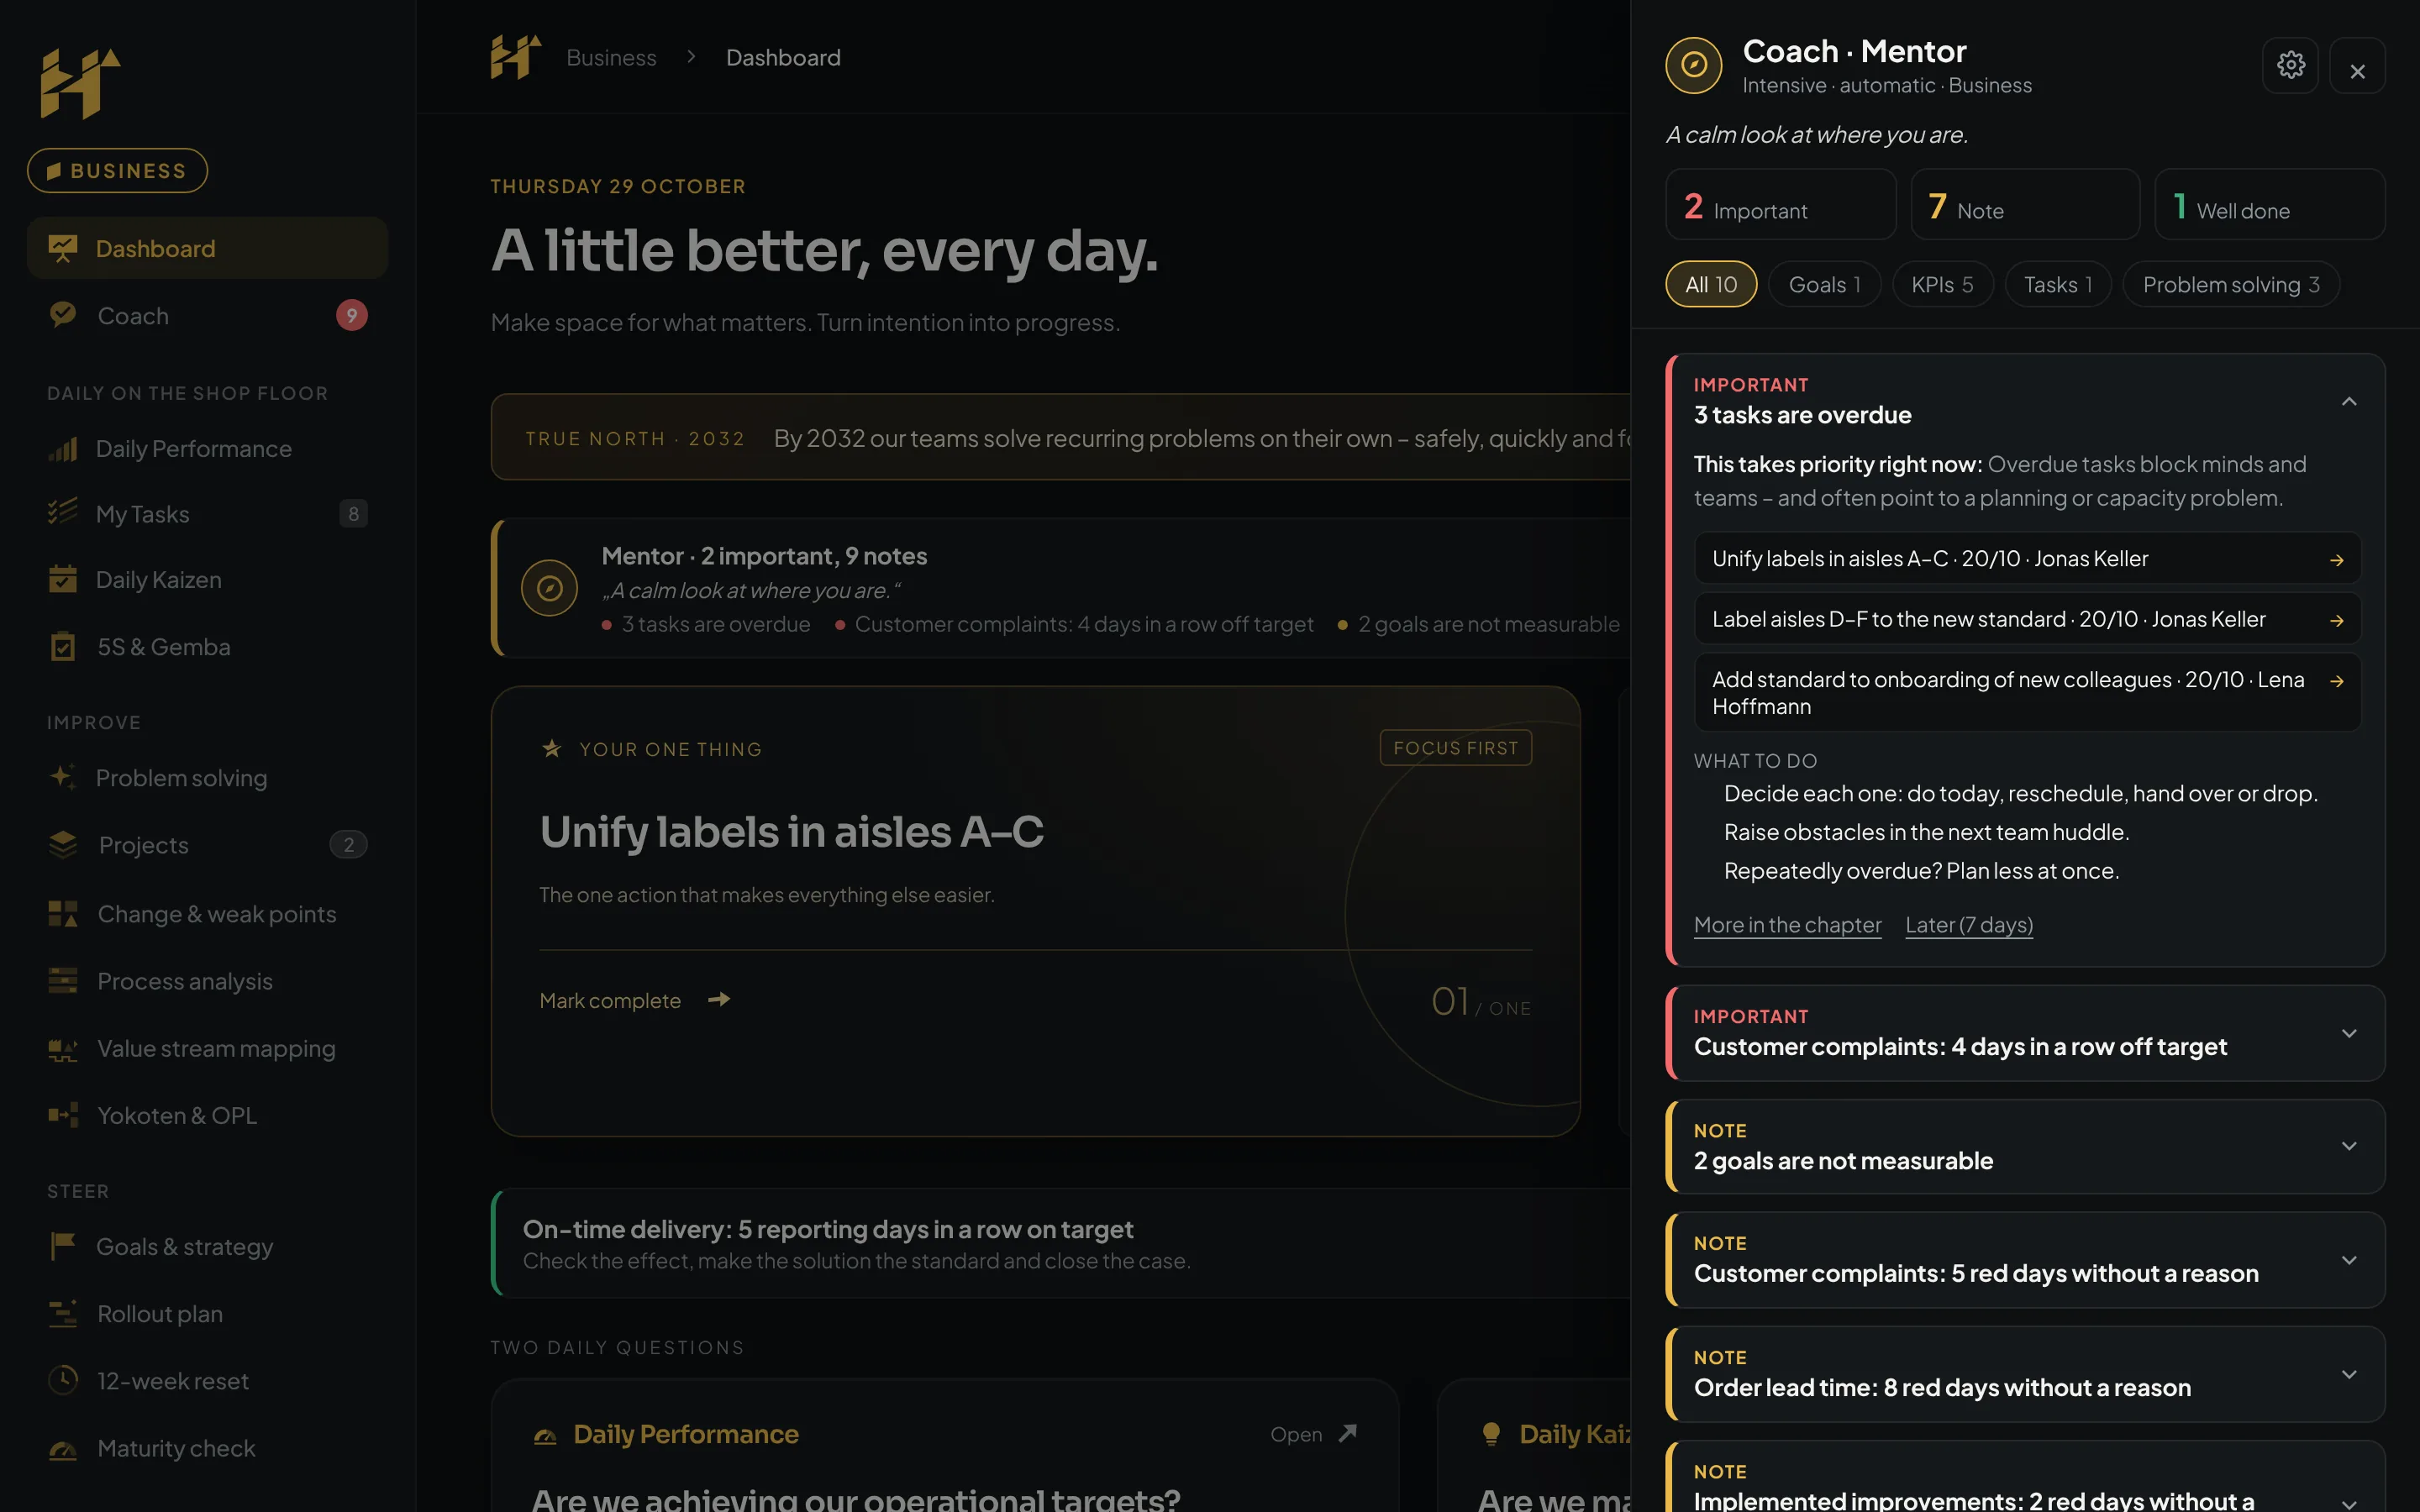
- Coach with hints on goals, KPIs, tasks and deviations
- Work together as a team – PC and phone
The order follows feedback from practice.
- Automatic transfer of daily values from Power BI and Excel – today by file import
- More learning paths and templates – based on feedback from pilot teams
- PC and phone
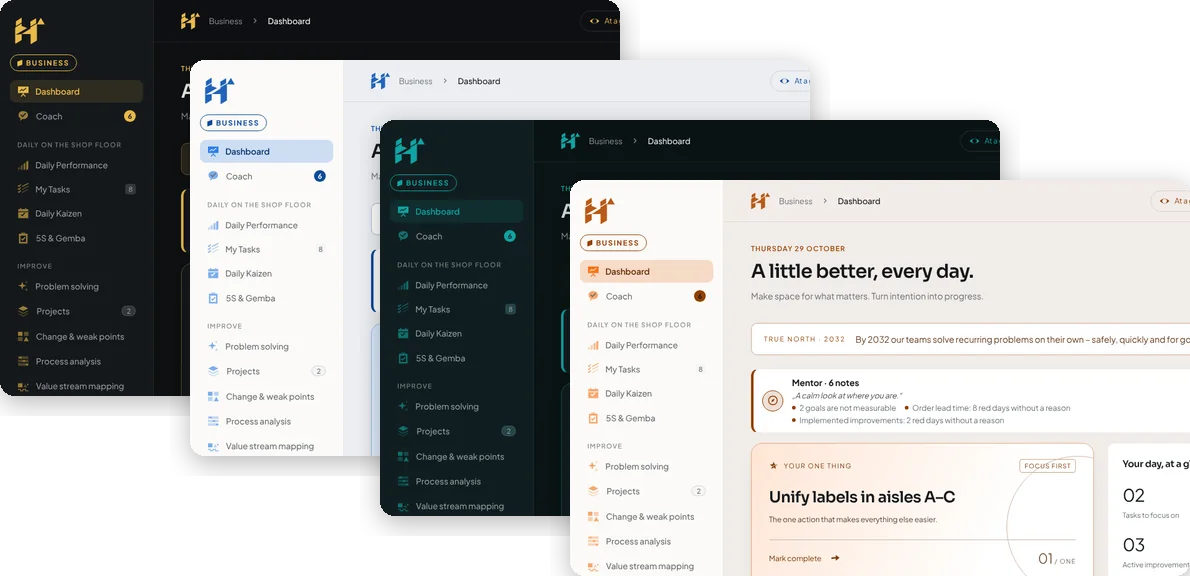
- English and German
- Light and dark design
- Your own colours